With advances in Digital Planning and Urban Analytics, new indicators are being produced to help understand cities and urban change. These indicators include for example new measures of transport accessibility, urban sustainability and improved ways to track development. Visualising these datasets together through interactive mapping and charts allows cities to be compared, and provides an overview of urban patterns and trends.
That’s the concept behind ENHANCE Cities, a new mapping tool that we are launching at CASA UCL. ENHANCE Cities maps a series of planning and transport sustainability indicators for England and Wales, from national to neighbourhood scales. The indicators include Connectivity Metrics from the DfT, housing development using Energy Performance Certificate data, and brownfield site data from MHCLG. Additionally, we have created a Travel Sustainability Index to measure travel behaviour; and a Local Accessibility Measure that summarises access to local amenities by sustainable modes. We have also included previous CASA work on House Prices per Square Metre. You can access the ENHANCE Cities site here- https://enhancecities.org
Using the ENHANCE Cities Tool to Understand Accessibility and Travel Behaviour
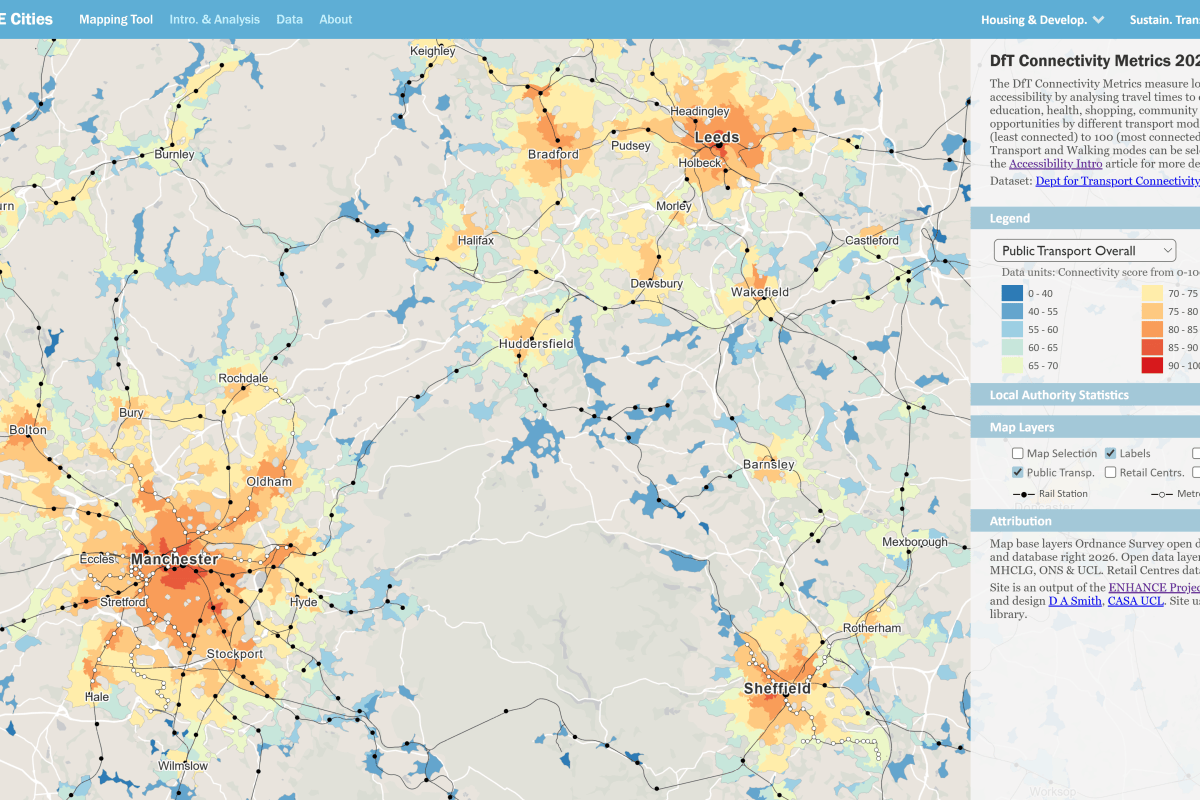
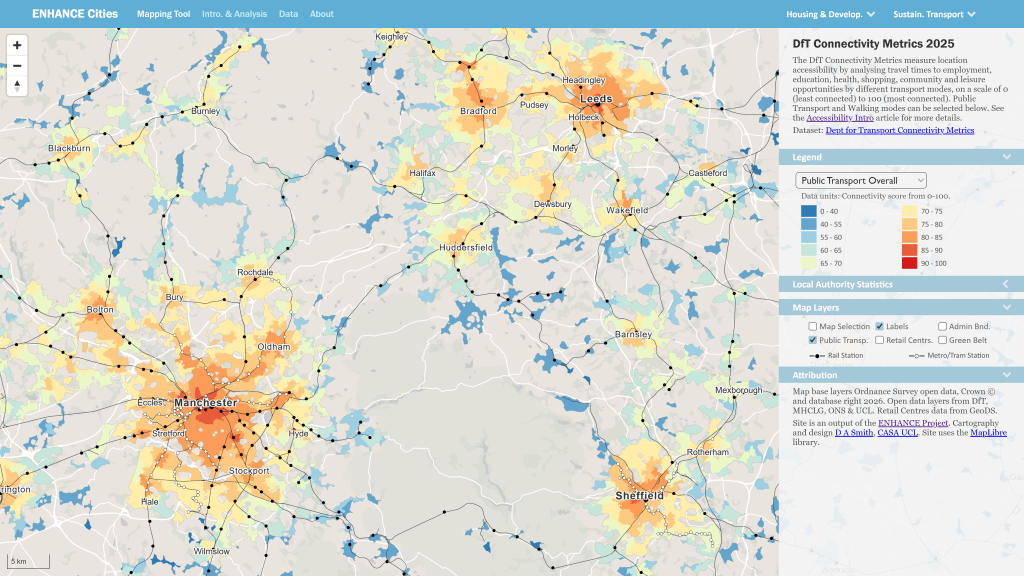
Achieving a mode shift to public transport and active travel is an important policy goal for health and sustainability, and improving access to jobs and services is also beneficial for urban economies. Accessibility indicators measure opportunities to key destinations (shops, schools, jobs…) by different modes of transport, and the Department for Transport have recently created sophisticated Connectivity Metrics for England and Wales, describing mode-specific accessibility to different destination types, which are mapped on the ENHANCE Cities site–
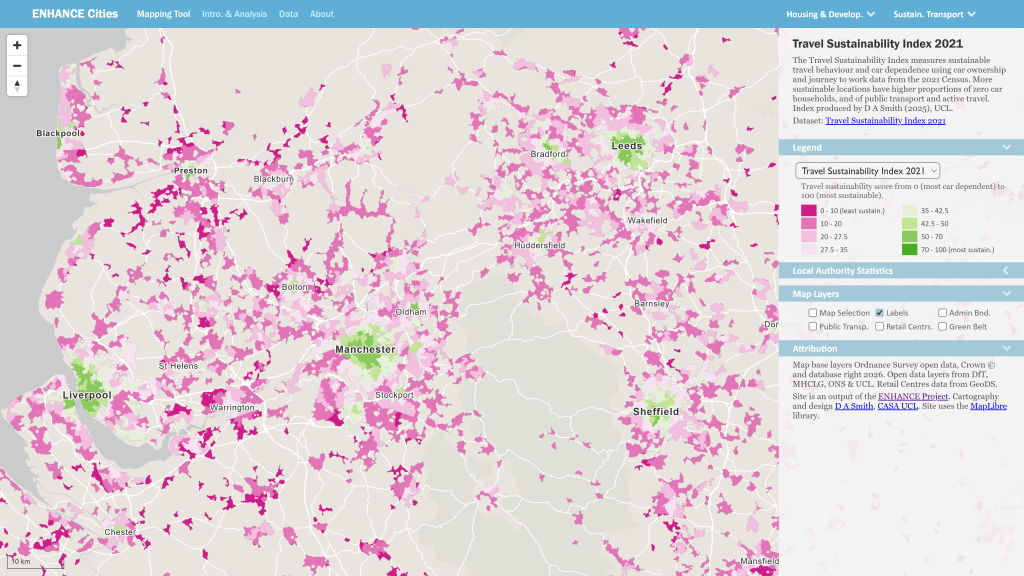
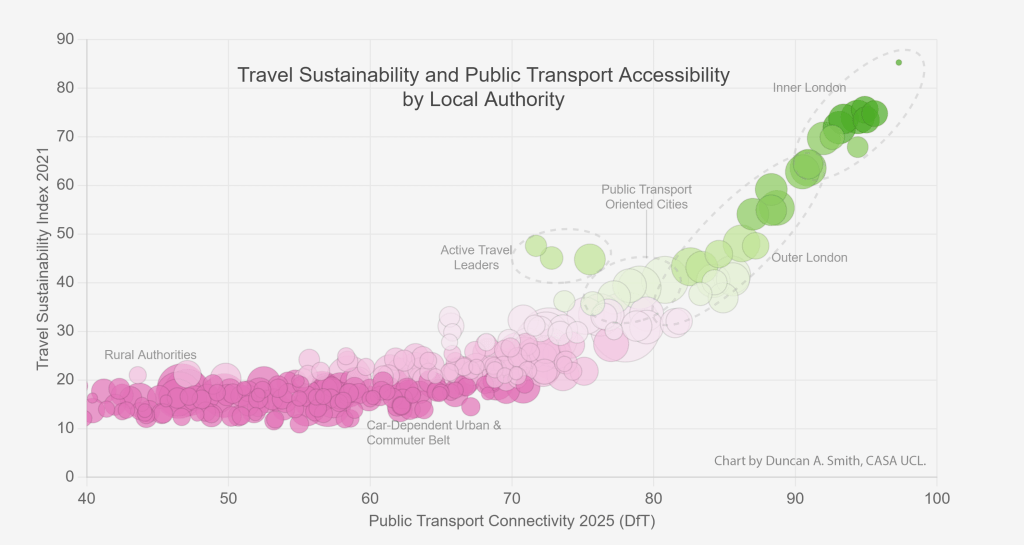
An important question is how accessibility relates to actual travel behaviour. The ENHANCE site allows you to compare accessibility measures with travel behaviour using the Travel Sustainability Index, which is derived from census data on car ownership and journey to work. These indicators can be be compared using interactive maps for cities and authorities in England and Wales, and we have also have graphed this relationship, showing how accessibility by sustainable modes underpins sustainable travel outcomes (more discussion here)-
Mapping Transit Oriented Development and Brownfield Sites
Another important aspect of sustainable planning is the integration of new development with public transport infrastructure. Using the Energy Performance Certificate data, we have mapped all new housing development from the last 15 years in relation to rail and metro systems. You can see good examples of integration between public transport and housing development in cities such as Manchester-
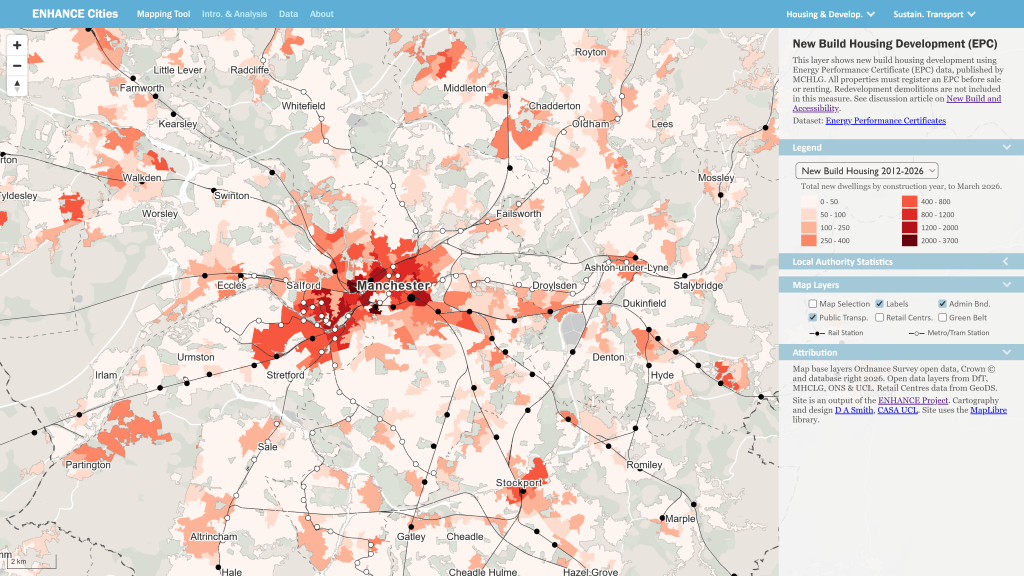
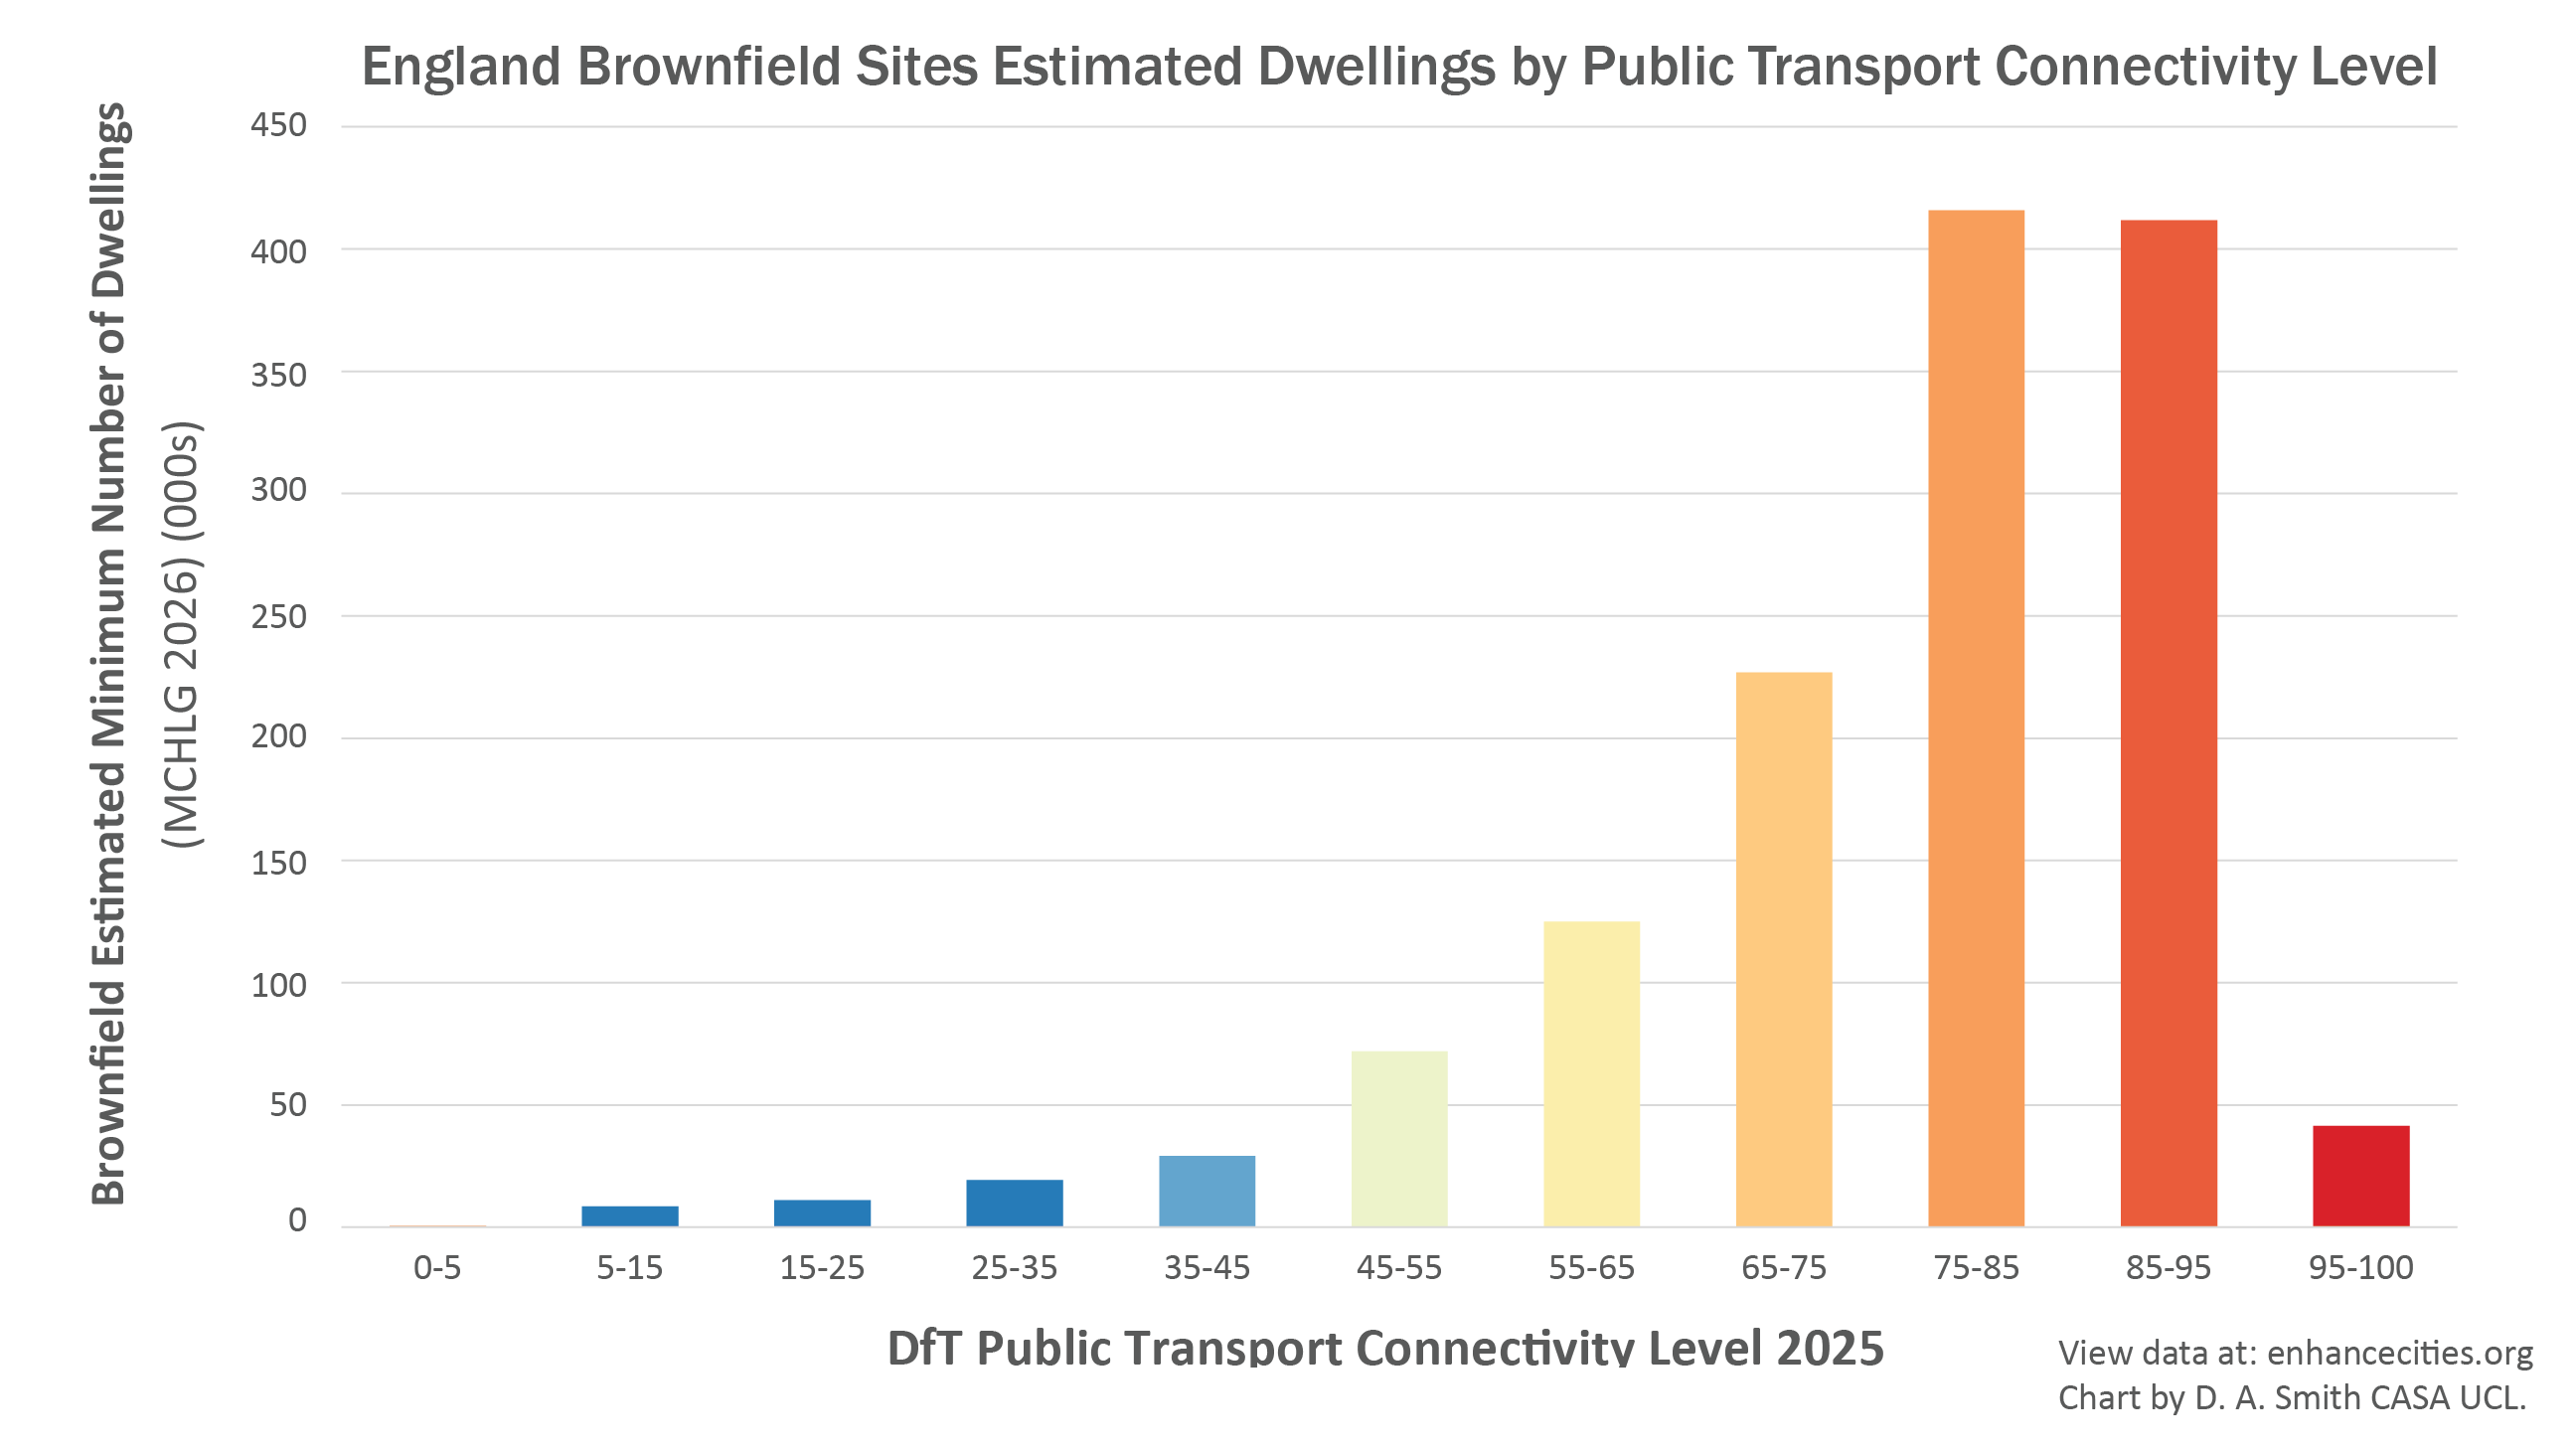
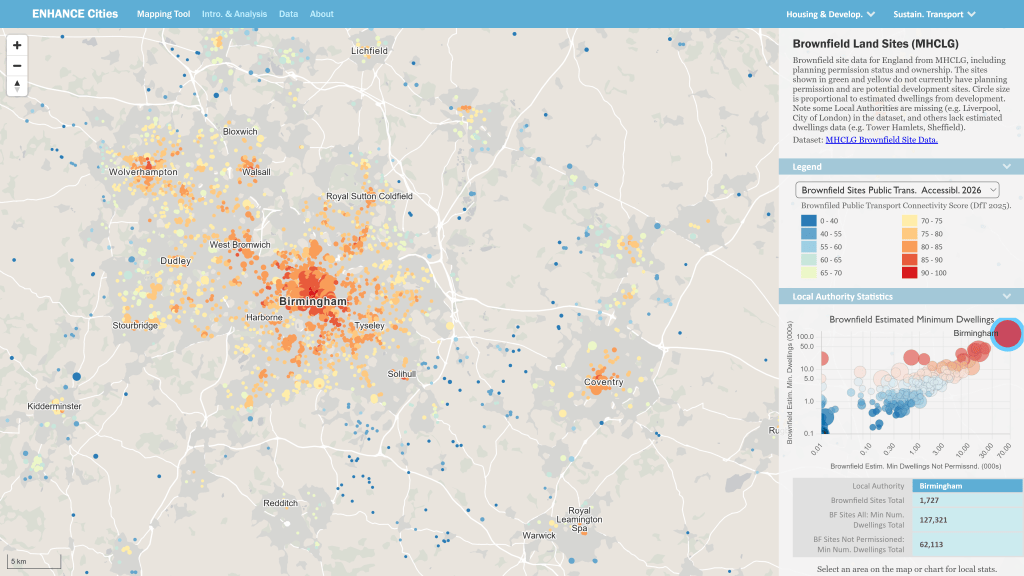
The EPC data shows a broad mix of development across England and Wales in the last 15 years, both sustainable outcomes in urban areas and more car-dependent development in commuter belt and more rural areas. Brownfield development is a key route to achieving sustainable development in urban areas, and using the MHCLG data, we can map brownfield sites across England. By joining the Brownfield data with the DfT Public Transport Connectivity Metric, we can demonstrate that brownfield sites are strongly concentrated in accessible urban locations (more discussion here)-
Local Accessibility and the 15 Minute City
There has been a major international movement towards proximity planning and active travel through the concept of the 15 Minute City. We have created a Local Accessibility Measure that analyses travel time to the nearest opportunities for 40 different types of services and amenities, using walking and public transport modes. You can explore travel times to individual destination types, and overall scores for Local Accessibility-
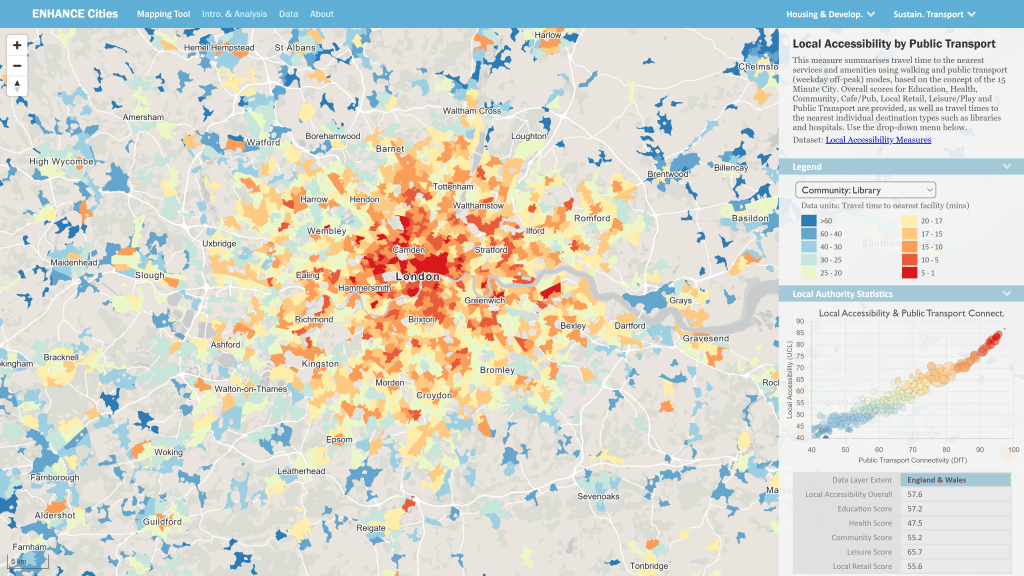
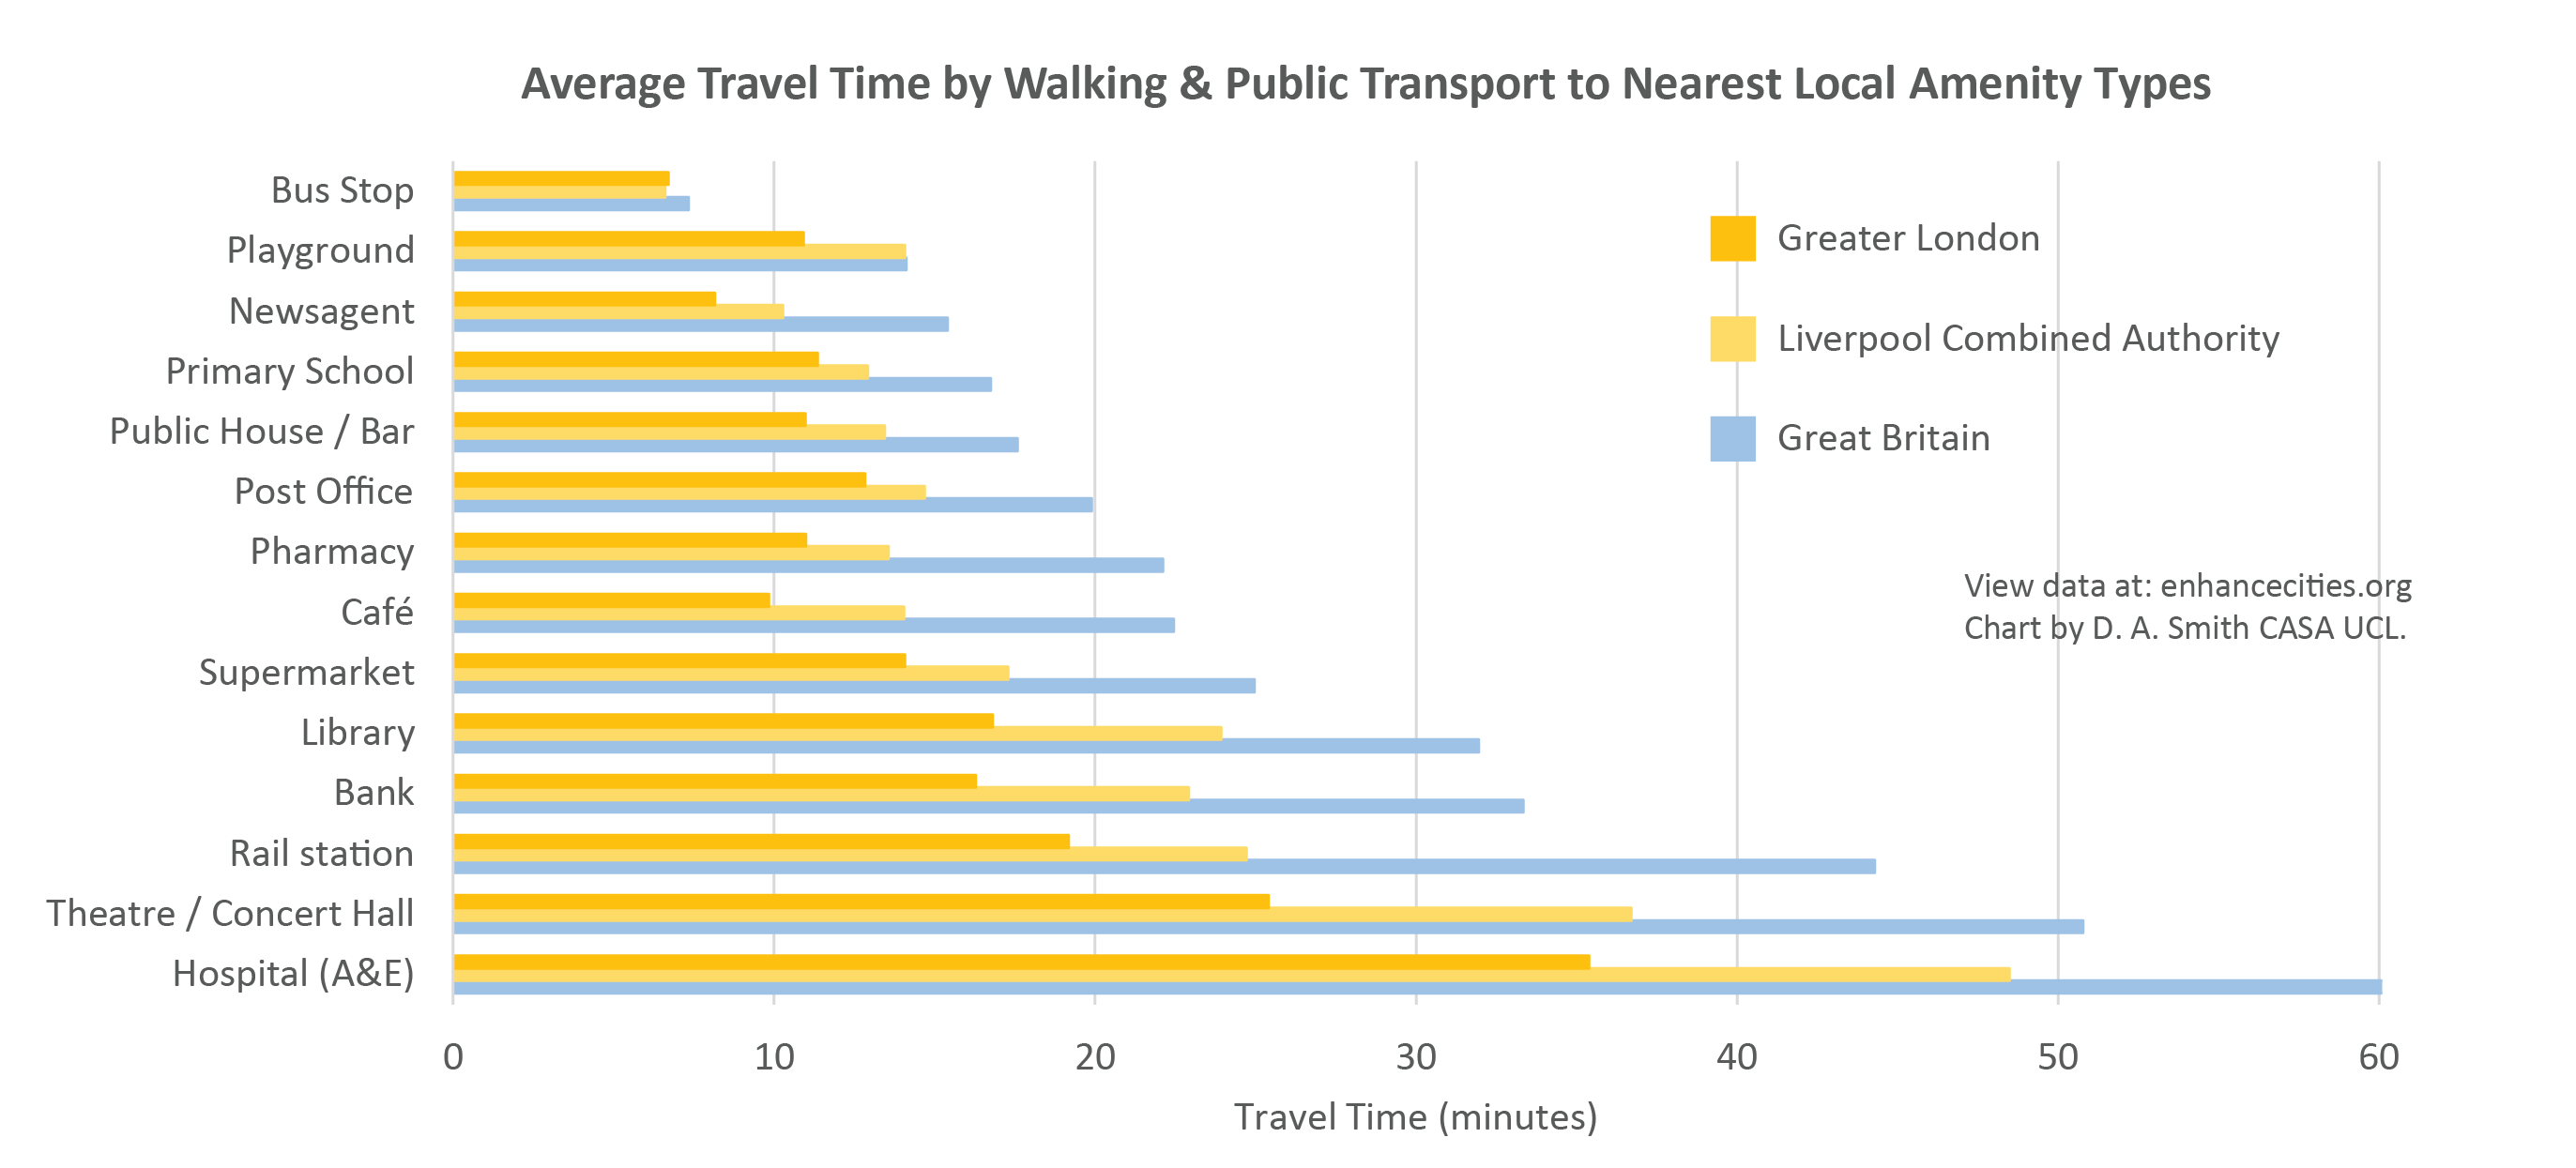
The Local Accessibility Measure provides a more nuanced understanding of the 15 Minute City. Large urban areas in Britain overwhelmingly provide 15 minute accessibility for ubiquitous destination types such as local retail, schools and cafes. The chart below shows average travel times to a selection of nearest facilities in Greater London, the Liverpool Combined Authority area, and the overall average for Great Britain. You can see average travel times around 10-15 minutes for ubiquitous destination types such as newsagents and pubs, while travel times start to increase for amenities such as libraries, banks and rail stations. For highly specialised destination types such as A&E Hospitals, average travel times are above 30 minutes in major cities and over an hour for Britain as a whole (more discussion here)-
Feedback on the ENHANCE Mapping Tool
We welcome feedback from city authorities, planners and researchers on this new tool. We are particularly interested in additional datasets or indicators that would be useful to in relation to urban planning and sustainable development. Please email info@enhancecities.org, or you can get in touch with Duncan Smith at UCL. Note, we have endeavoured to make the new indicators as accurate as possible, but these are not official statistics and may have errors. More information on the indicator methodologies can be found here- https://enhancecities.org/data.html
About the ENHANCE Project
The ENHANCE Project is investigating how accessibility indicators and travel behaviour analysis can be used to provide evidence of sustainable planning in regional towns and cities. The project is funded by the Economic and Social Research Council and is part of the Driving Urban Transitions European network. More info here.

