Creating the Gridded Data
All the datasets on LuminoCity3D are presented on a 1km2 hexagon grid, intended to standardise zones across GB and aid comparisons between urban areas.
The data transformations were performed using a technique called a proportional spatial join. The original data (generally at output area and workplace zone level) is assumed to be equally distributed across the original zone. Then through a union operation this data is assigned to zones in the hexagon grid, and split across zones if the original census zone falls across more than one hexagon zone.
This transformation will produce some errors, as the original data may not necessarily be evenly distributed spatially. However these errors will be very minor where the original zones are significantly smaller than the hexagon grid geography. This is the case in urban areas as illustrated below.
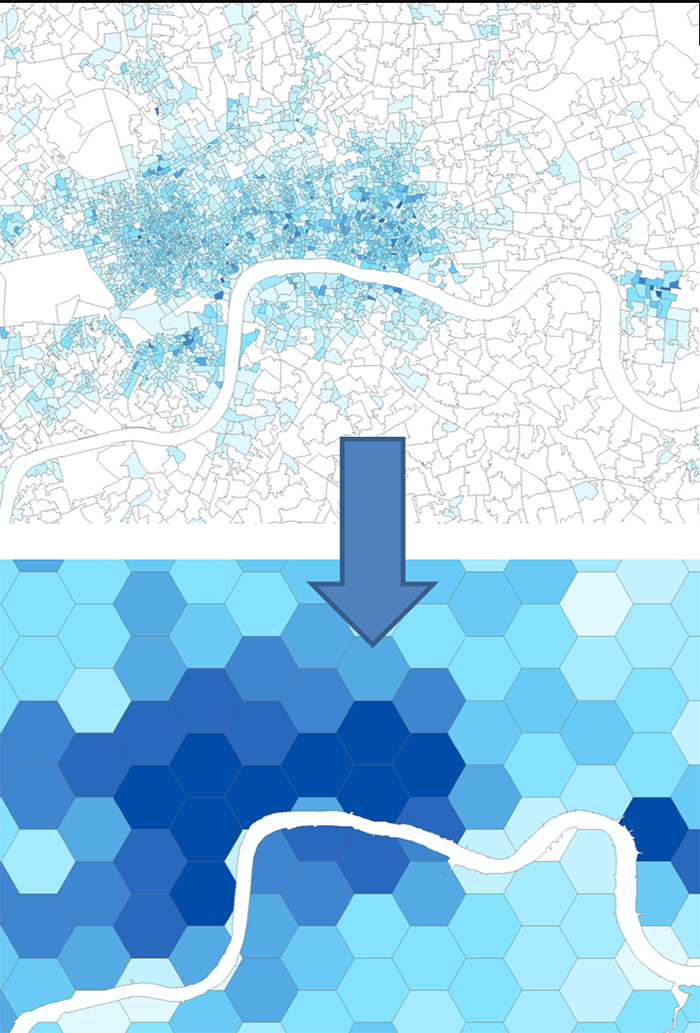
The grid approach is more problematic in rural and semi-rural areas, where populations are sparser and the census geography zones are larger. In this case MAUP errors from the data transformation are much more significant. In light of this problem the LuminoCity3D website has a density threshold cut-off at which data values are not shown. The cut-off is 10 residents&jobs per hectare, and this removes villages and rural areas from the visualisation.
As the LuminoCity3D website is designed for displaying urban maps and data, this threshold is judged to be acceptable. This approach does however mean that 15% of the GB population living in villages and rural areas are not shown on the map.
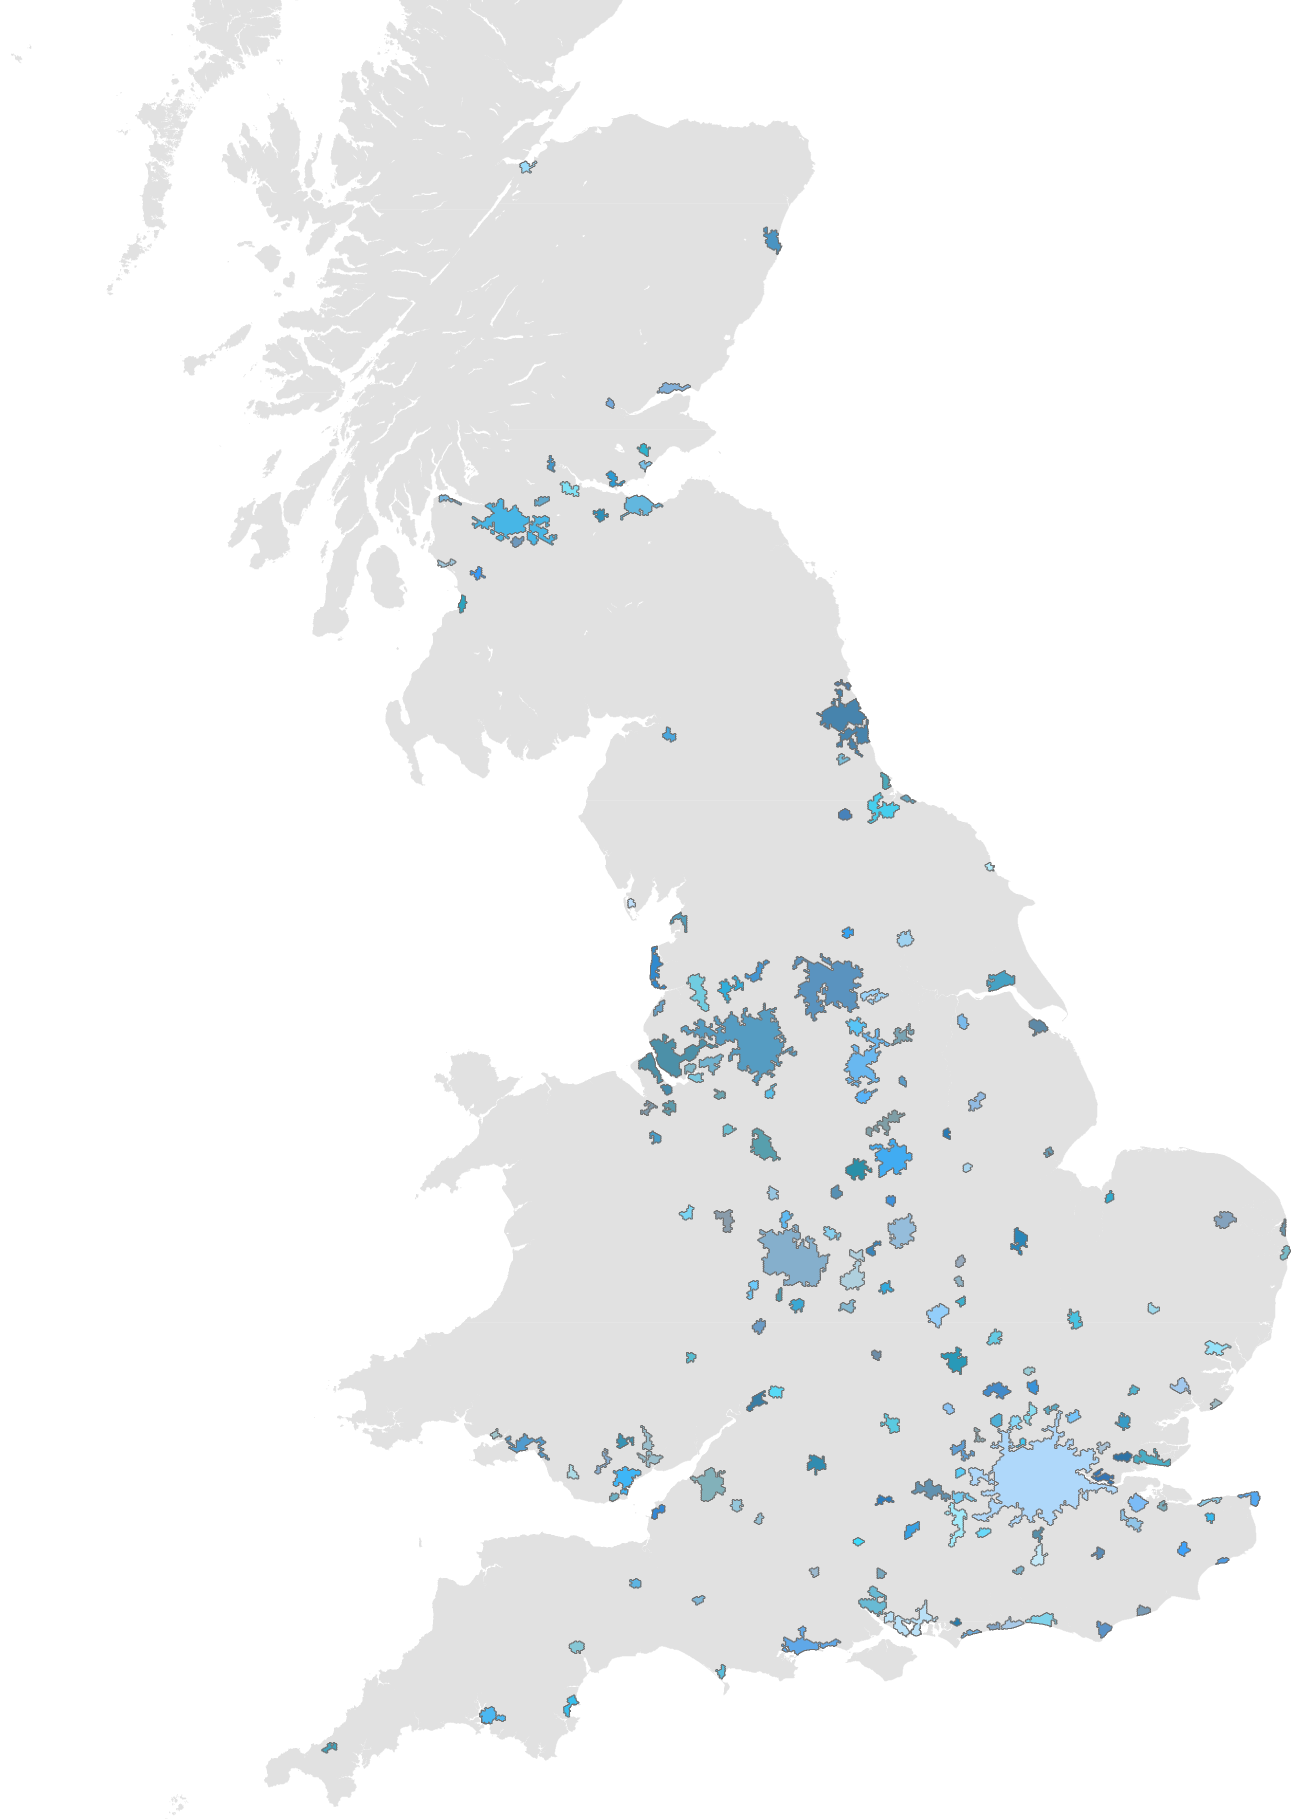
Defining Urban Area Clusters
Calculating urban statistics requires defining boundaries for urban areas. Typically these are political boundaries, which in the UK would be local authorities, or their amalgamation into larger geographies such as local enterprise partnerships and primary urban areas. LuminoCity3D takes a different approach where city areas are defined through continuous areas of population and employment density.
This requires setting a density threshold, which for LuminoCity3D is 14 residents&jobs per hectare. While this value is arbitrary to a degree, it does produce a geography that resembles commonly held conceptions of GB city regions (see below) such as Tyne & Wear, Greater Manchester, West Yorkshire and the West Midlands. Lower thresholds tend to result in very large city-regions with Liverpool and Manchester joining into a single city-region, and London stretching even further across the South-East. Higher thresholds result in very tightly defined urban areas that comprise a smaller proportion of the overall GB population.
The LuminoCity3D clusters using the threshold of 14 residents&jobs per hectare cover 40 million people or 65% of the overall GB population.

Your system fails when attempting to define the Liverpool conurbation, because the River Mersey appears as empty space, whereas rivers such as the Thames, Clyde and Tyne are narrower and don’t cause the same problem. This leads to regular underestimation of Liverpool’s population by excluding areas such as the Wirral, Ellesmere Port and Runcorn. Thus you have Greater Manchester’s population at more than twice Greater Liverpool’s – which is plainly ridiculous. Perhaps analysis of peoples’ accent/way of speaking would be a more accurate measure.
Hi, thanks for your comment. It’s not possible to devise a perfect regional definition as cities inherently have many interactions at different scales, and there is no one approach that everyone will agree with. For example for Liverpool there are definitions for the Liverpool Urban Area, Liverpool Combined Authority, Merseyside metropolitan county and several more.
Since LuminoCity is based on mapping urban form, I used a consistent density approach to define city regions for all of Great Britain. It is not ‘ridiculous’ to find that Greater Manchester is twice the size of Greater Liverpool, it’s quite common. For example the Primary Urban Area approach used by Centre for Cities also calculates that Manchester is over twice the size of Liverpool-
http://www.centreforcities.org/data-tool/#graph=map&indicator=populationsingle2013
Also the combined authorities that are now being developed also point to Greater Manchester’s population being over twice the size of Greater Liverpool/Merseyside.