
LuminoCity3D: Explore the Performance and Dynamics of GB Cities
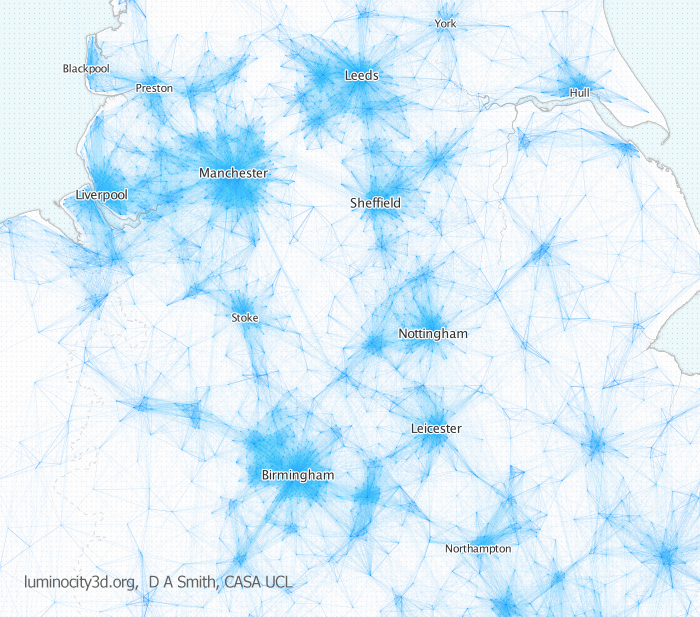
LuminoCity3D.org is a mapping platform designed to explore the performance and dynamics of cities in Great Britain. The site brings together a wide range of key city indicators, including population, growth, housing, travel behaviour, employment, business location and energy use. These indicators are mapped using a new 3D approach that highlights the size and density of urban centres, and allows relationships between urban form and city performance to be analysed. Press coverage of LuminoCity3D has included Londonist, Wired.co.uk, Independent Online and Guardian Cities.
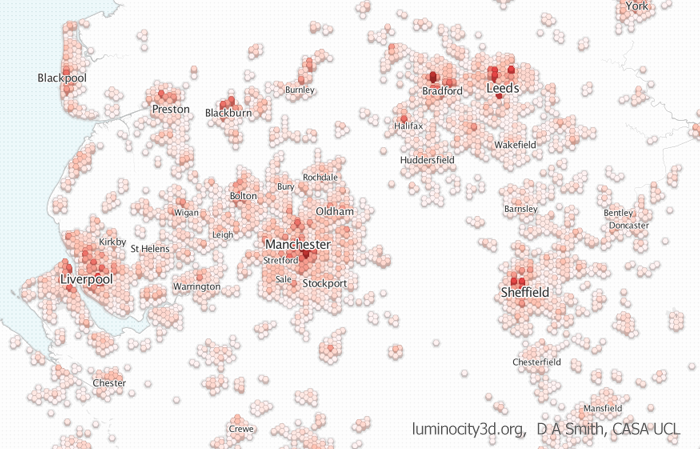
LuminoCity’s maps and graphs enable consistent comparisons to be made between urban areas. All the datasets have been transformed to a 1km2 grid, providing a standardised spatial framework for the whole of Great Britain. Additionally the grid cells are displayed as 3D blocks, with heights representing population density (for residential population indicators) or employment density (for workplace indicators) in the manner of a 3D cartogram. The maps therefore represent where people live and work, and intuitively display the diverse scales of urban centres.
Interactive City Statistics
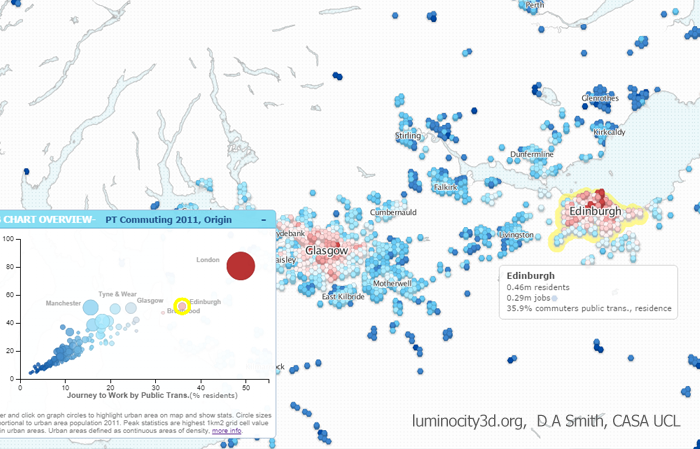
LuminoCity’s mapping approach is ideally suited to visualising patterns at city-region scales. Relationships and interactions within large conurbations, e.g. Greater Manchester/West Midlands/West Yorkshire, or across urban regions, e.g. South East England/Scotland Central Belt/Tyne & Wear, can be easily viewed. Additionally in-depth statistics have been calculated to make more precise comparisons between urban areas. Statistics can be viewed by moving your mouse pointer over a city of interest, or by hovering/clicking on the GB Overview Chart at the bottom left of the screen. The graphs and statistics change depending on the map indicator selected, so that the LuminoCity maps and statistics are interactively integrated.
Measuring city statistics requires the definition of urban boundaries. Rather than use the typical political boundary approach (UK political boundaries are inconsistent, and often much smaller than actual urban areas), a consistent functional approach is used here. Urban area boundaries are defined as continuous areas of where population and employment density exceed a density threshold, based on the LuminoCity 1km2 data grid. More technical details on this definition and the spatial analysis used to create LuminoCity are provided here.
City Research and Policy Challenges
There are many current research and policy challenges for cities in Great Britain, such as the north-south divide, city-centre intensification, structural economic change, and improving urban sustainability. The LuminoCity platform has been designed to provide relevant indicators for these challenges. Discussions on how patterns identified in LuminoCity3D can be used for urban research and policy can be found in the Themes section, with the first themes article discussing uneven urban growth and overheating London.
Comments and feedback on the site are very welcome. Have a look at the Comments & FAQ page, tweet @citygeographics, or email duncan2001@gmail.com.
LuminoCity3D Credits
Site design and cartography © Duncan A. Smith 2014. Data hosted at CASA UCL with generous help from Steven Gray.
Maps created using TileMill opensource software by Mapbox. Website design uses the following javascript libraries- leaflet.js, mapbox.js and dimple.js (based on d3.js).
Source data Crown © Office for National Statistics, National Records of Scotland, DEFRA, Land Registry, DfT and Ordnance Survey 2014.
All the datasets used are government open data. Websites such as LuminoCity would not be possible without recent open data initiatives and the release of considerable government data into the public domain. Links to the specific datasets used in each map are provided to the bottom right of the page under “Source Data”.
