The housing crisis in London has become increasingly severe in the last decade with much higher prices, rents, and largely static incomes, while housing development volumes have remained consistently below targets. Green Belt reform is often cited as a solution to boost development, though this has been off the agenda during the last 13 years of Conservative government. Recent announcements by the Labour leadership, supporting Green Belt reform and setting ambitious targets for housing development, could change this state of affairs with the general election coming in 2024.
This article analyses housing development in the London region from 2011-2022 (full CASA Working Paper here), using the Energy Performance Certificate Data. There is strong evidence that the Green Belt is a major barrier to development and is in need of reform. On the other hand, there are very substantial challenges around the quality and sustainability of new build housing in the South East. The analysis shows that, outside of Greater London, new build housing typically has poor travel sustainability and energy efficiency outcomes. Any release of Green Belt land needs to be dependent on travel sustainability criteria and improved energy efficiency for new housing. Sustainable housing outcomes are much more likely to be achieved through prioritising development in existing towns and cities and in Outer London.
London’s Housing Affordability Crisis
House prices in London doubled between 2009 and 2016, pricing out households on moderate and low incomes from home ownership, and translating into rent increases, longer social housing waiting lists, increased overcrowding and homelessness (see Edwards, 2016; LHDG, 2021). Price rises are linked to on the one hand to the financialization of housing (exacerbated by record low interest rates and Help to Buy loans in the 2010s) and on the other a long period of low housing supply, stretching back to the 1980s and the erosion of public housing.
The impact is record levels of unaffordability, with Inner London average house prices reaching £580k and Outer London £420k in 2016 (see chart below). The median house price to income ratio for Inner London soared from 9.9 in 2008 to 15.1 in 2016; for Outer London the ratio increased from 8.2 in 2008 to 11.8. In addition to high prices, first-time buyers have also been hit with record mortgage deposit requirements, with average deposits reaching £148,000 for Greater London, compared to around £10,000 in the late 1990s (Greater London Authority, 2022). Owner occupation is now effectively impossible in Inner, and much of Outer, London for low and moderate income buyers.

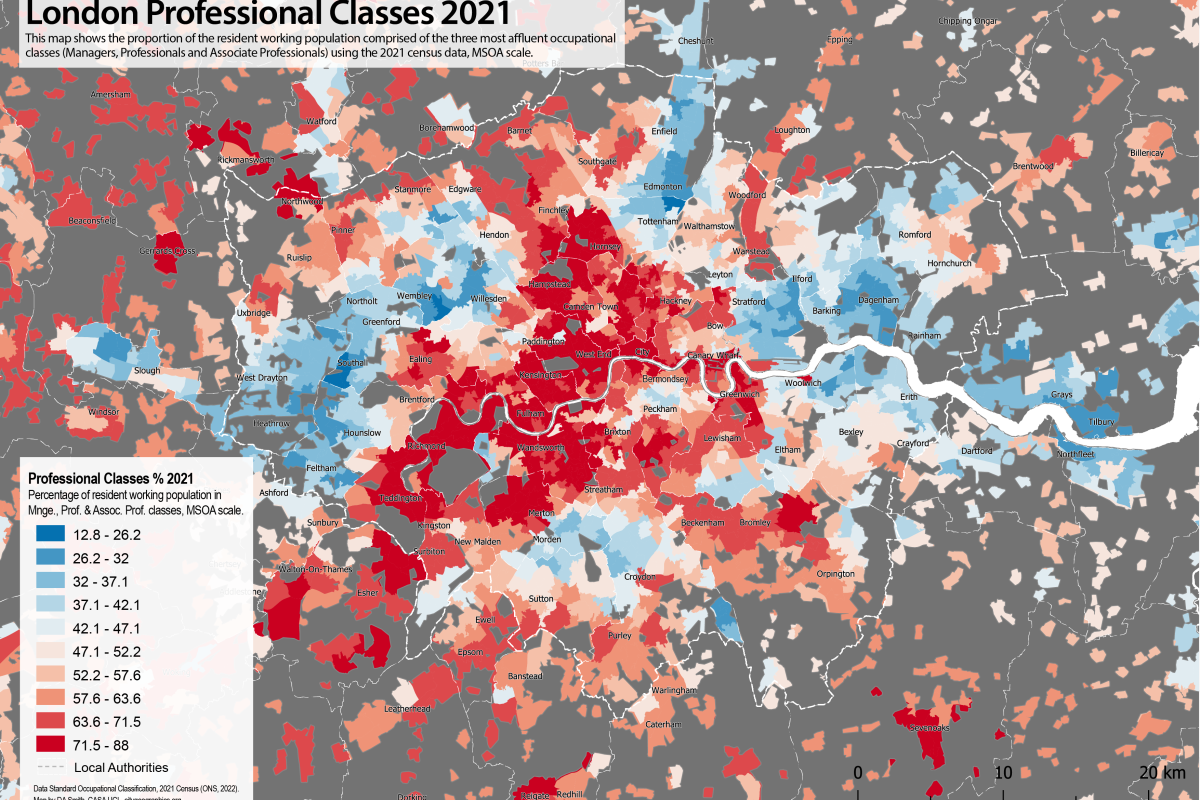
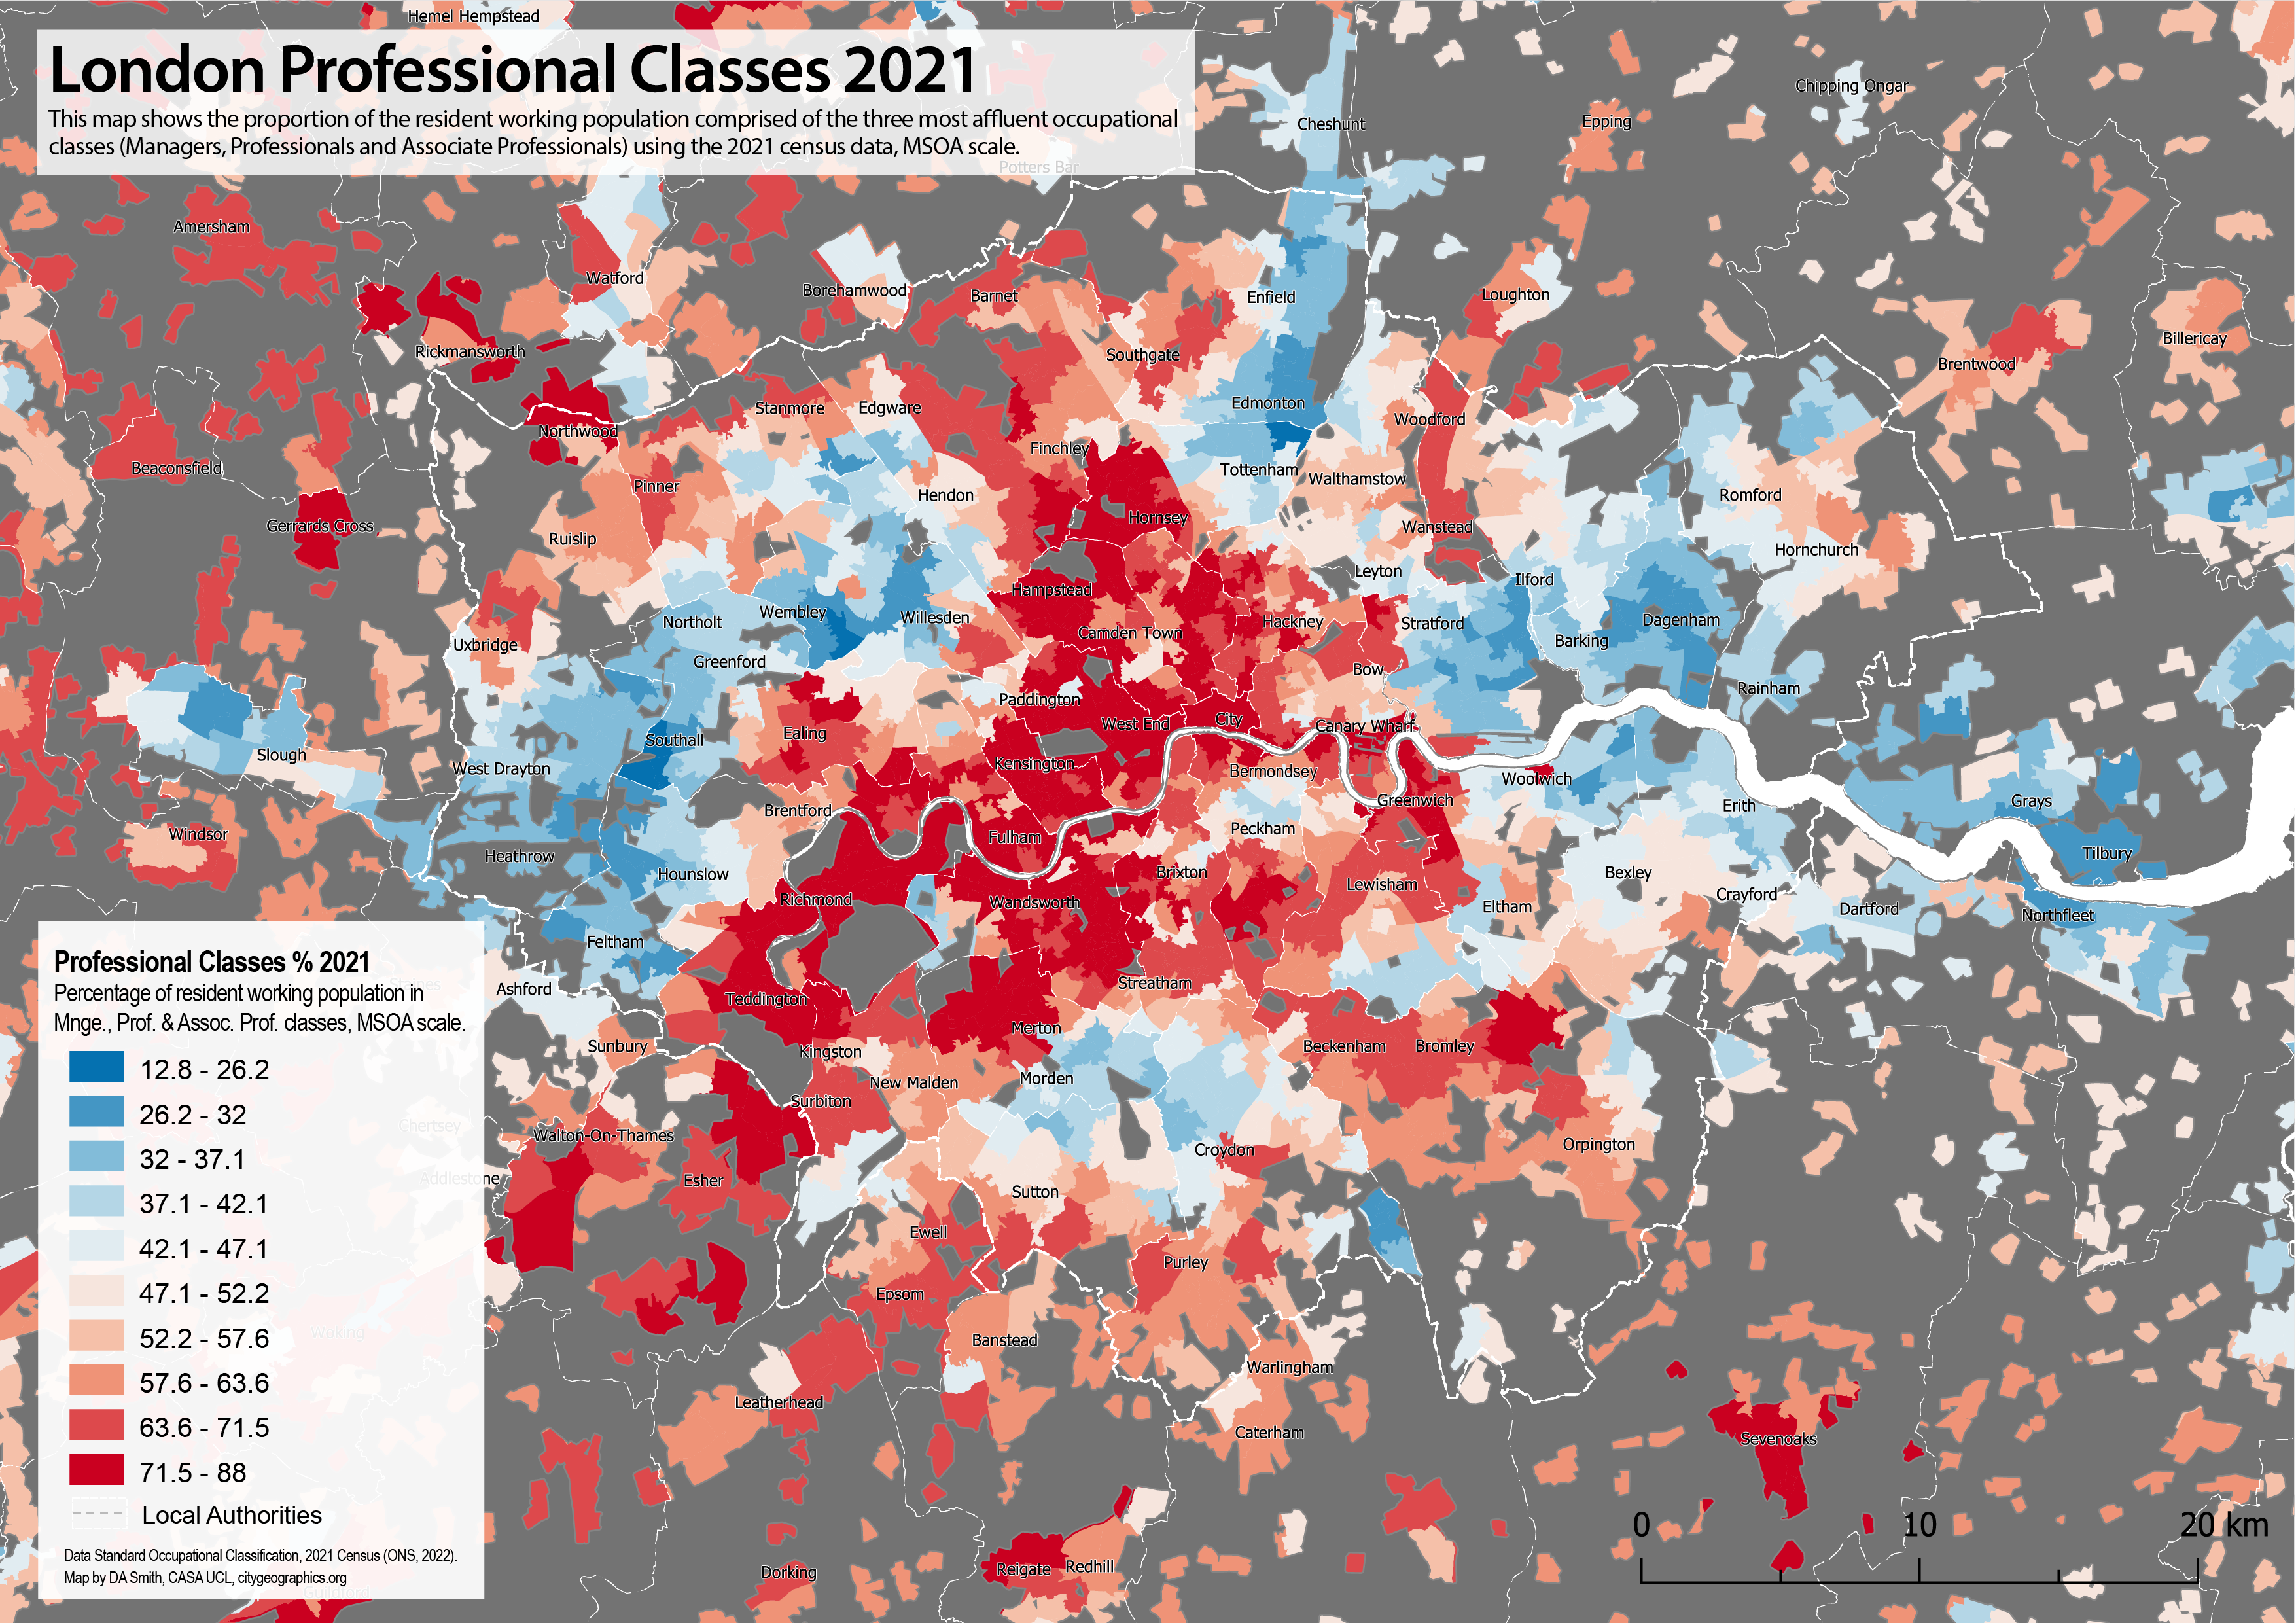
There have also been substantial increases in prices across the London region. The map below shows prices per square metre in the South East showing four radial corridors of high prices extending beyond Greater London into the Green Belt. East London is increasingly mirroring West London with two radial corridors of higher prices extending north-east and south-east from Inner East London. These are the primary areas of gentrification in London in the last decade (discussed in previous blog post), squeezing out what was the largest area of affordable market housing. There is also a distinct spatial alignment between London’s Green Belt boundary and higher prices, which is evidence of regional housing market integration, and that Green Belt restrictions are pushing up prices.

New Build Housing Delivery in the London Region
Greater London has struggled to meet its housing targets in the last decade. The current London Plan target is for 52k annual completions, which, as can be seen in the graph below, London is significantly short of. The 52k annual target has been criticised as being too low, with other estimates of housing need calculating that 66k or even 90k houses per year are needed (LHDG, 2021). Given the extremely high prices, affordable housing tenures are needed more than ever, yet affordable housing delivery has fallen in the 2010s (although note there has been progress in affordable housing starts in the last two years). Finally, the recent impacts of the pandemic and high interest rates have hit market housing activity, meaning that London will very likely continue to miss its overall housing targets for the next 2-3 years.

We can look in more detail at the geography of housing delivery at local authority level in the scatterplot below. There is high development in most of Inner London, and some Outer London boroughs. These boroughs contain Opportunity Areas (major development sites in the London Plan): Canary Wharf in Tower Hamlets; the Olympic Park in Newham; Battersea Power Station in Wandsworth; Hendon-Colindale in Barnet; Wembley in Brent; Old Oak Common-Park Royal in Ealing; and Croydon town centre. Given that there are only a few Opportunity Areas in Outer London, this leads to relatively low delivery in most Outer London boroughs, and points to the need for a wider strategy for Outer London development.

Meanwhile, there is low development activity in nearly all Green Belt local authorities, much lower than London boroughs and also below the average for the rest of the South East. Green Belt restrictions affect both local authorities in the commuter belt and also Outer London boroughs as well (e.g. Enfield, Bromley) with 27% of Outer London consisting of Green Belt land. We can confirm how rigidly Green Belt restrictions are being applied using the official statistics, which calculate that the London region Green Belt land area was 5,160km2 in 2011 and 5,085km2 in 2022 (DLUHC, 2023). Therefore, only 74km2 or 1.4% of Green Belt land was released over the decade (this figure is for all development uses, not only housing), which is strong evidence of minimal change.
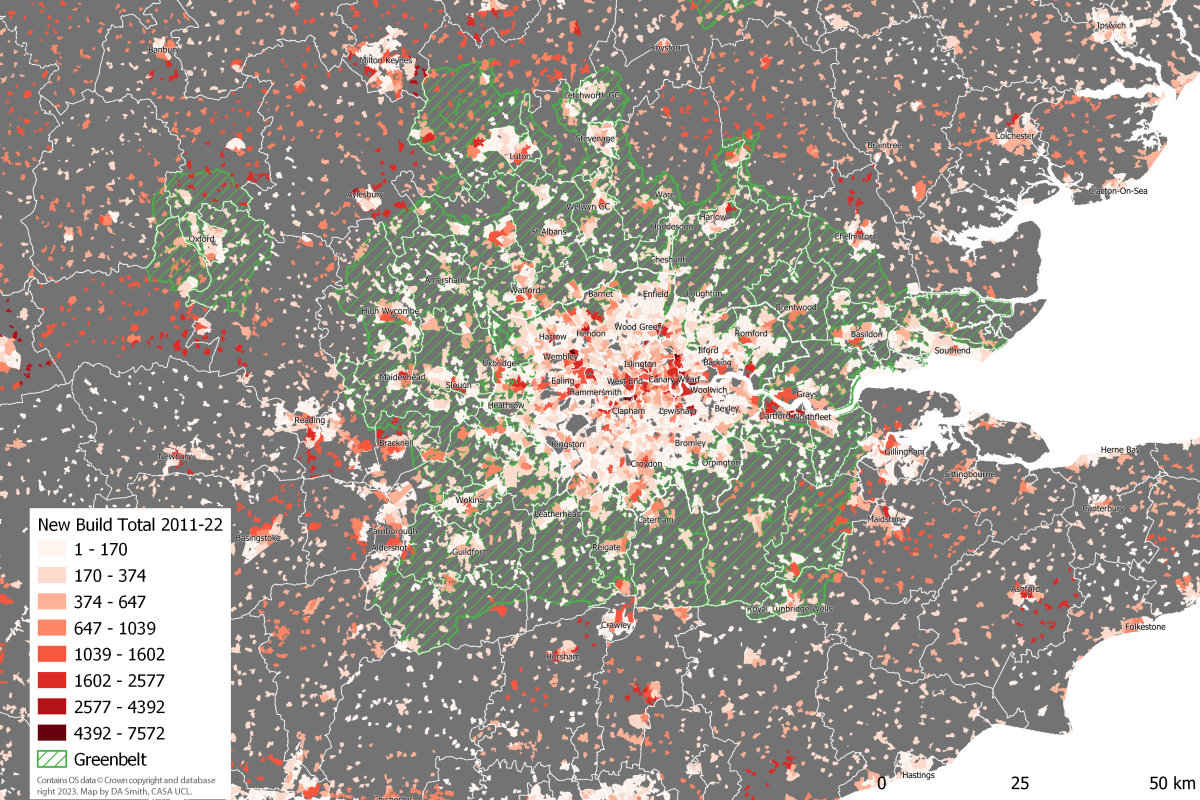
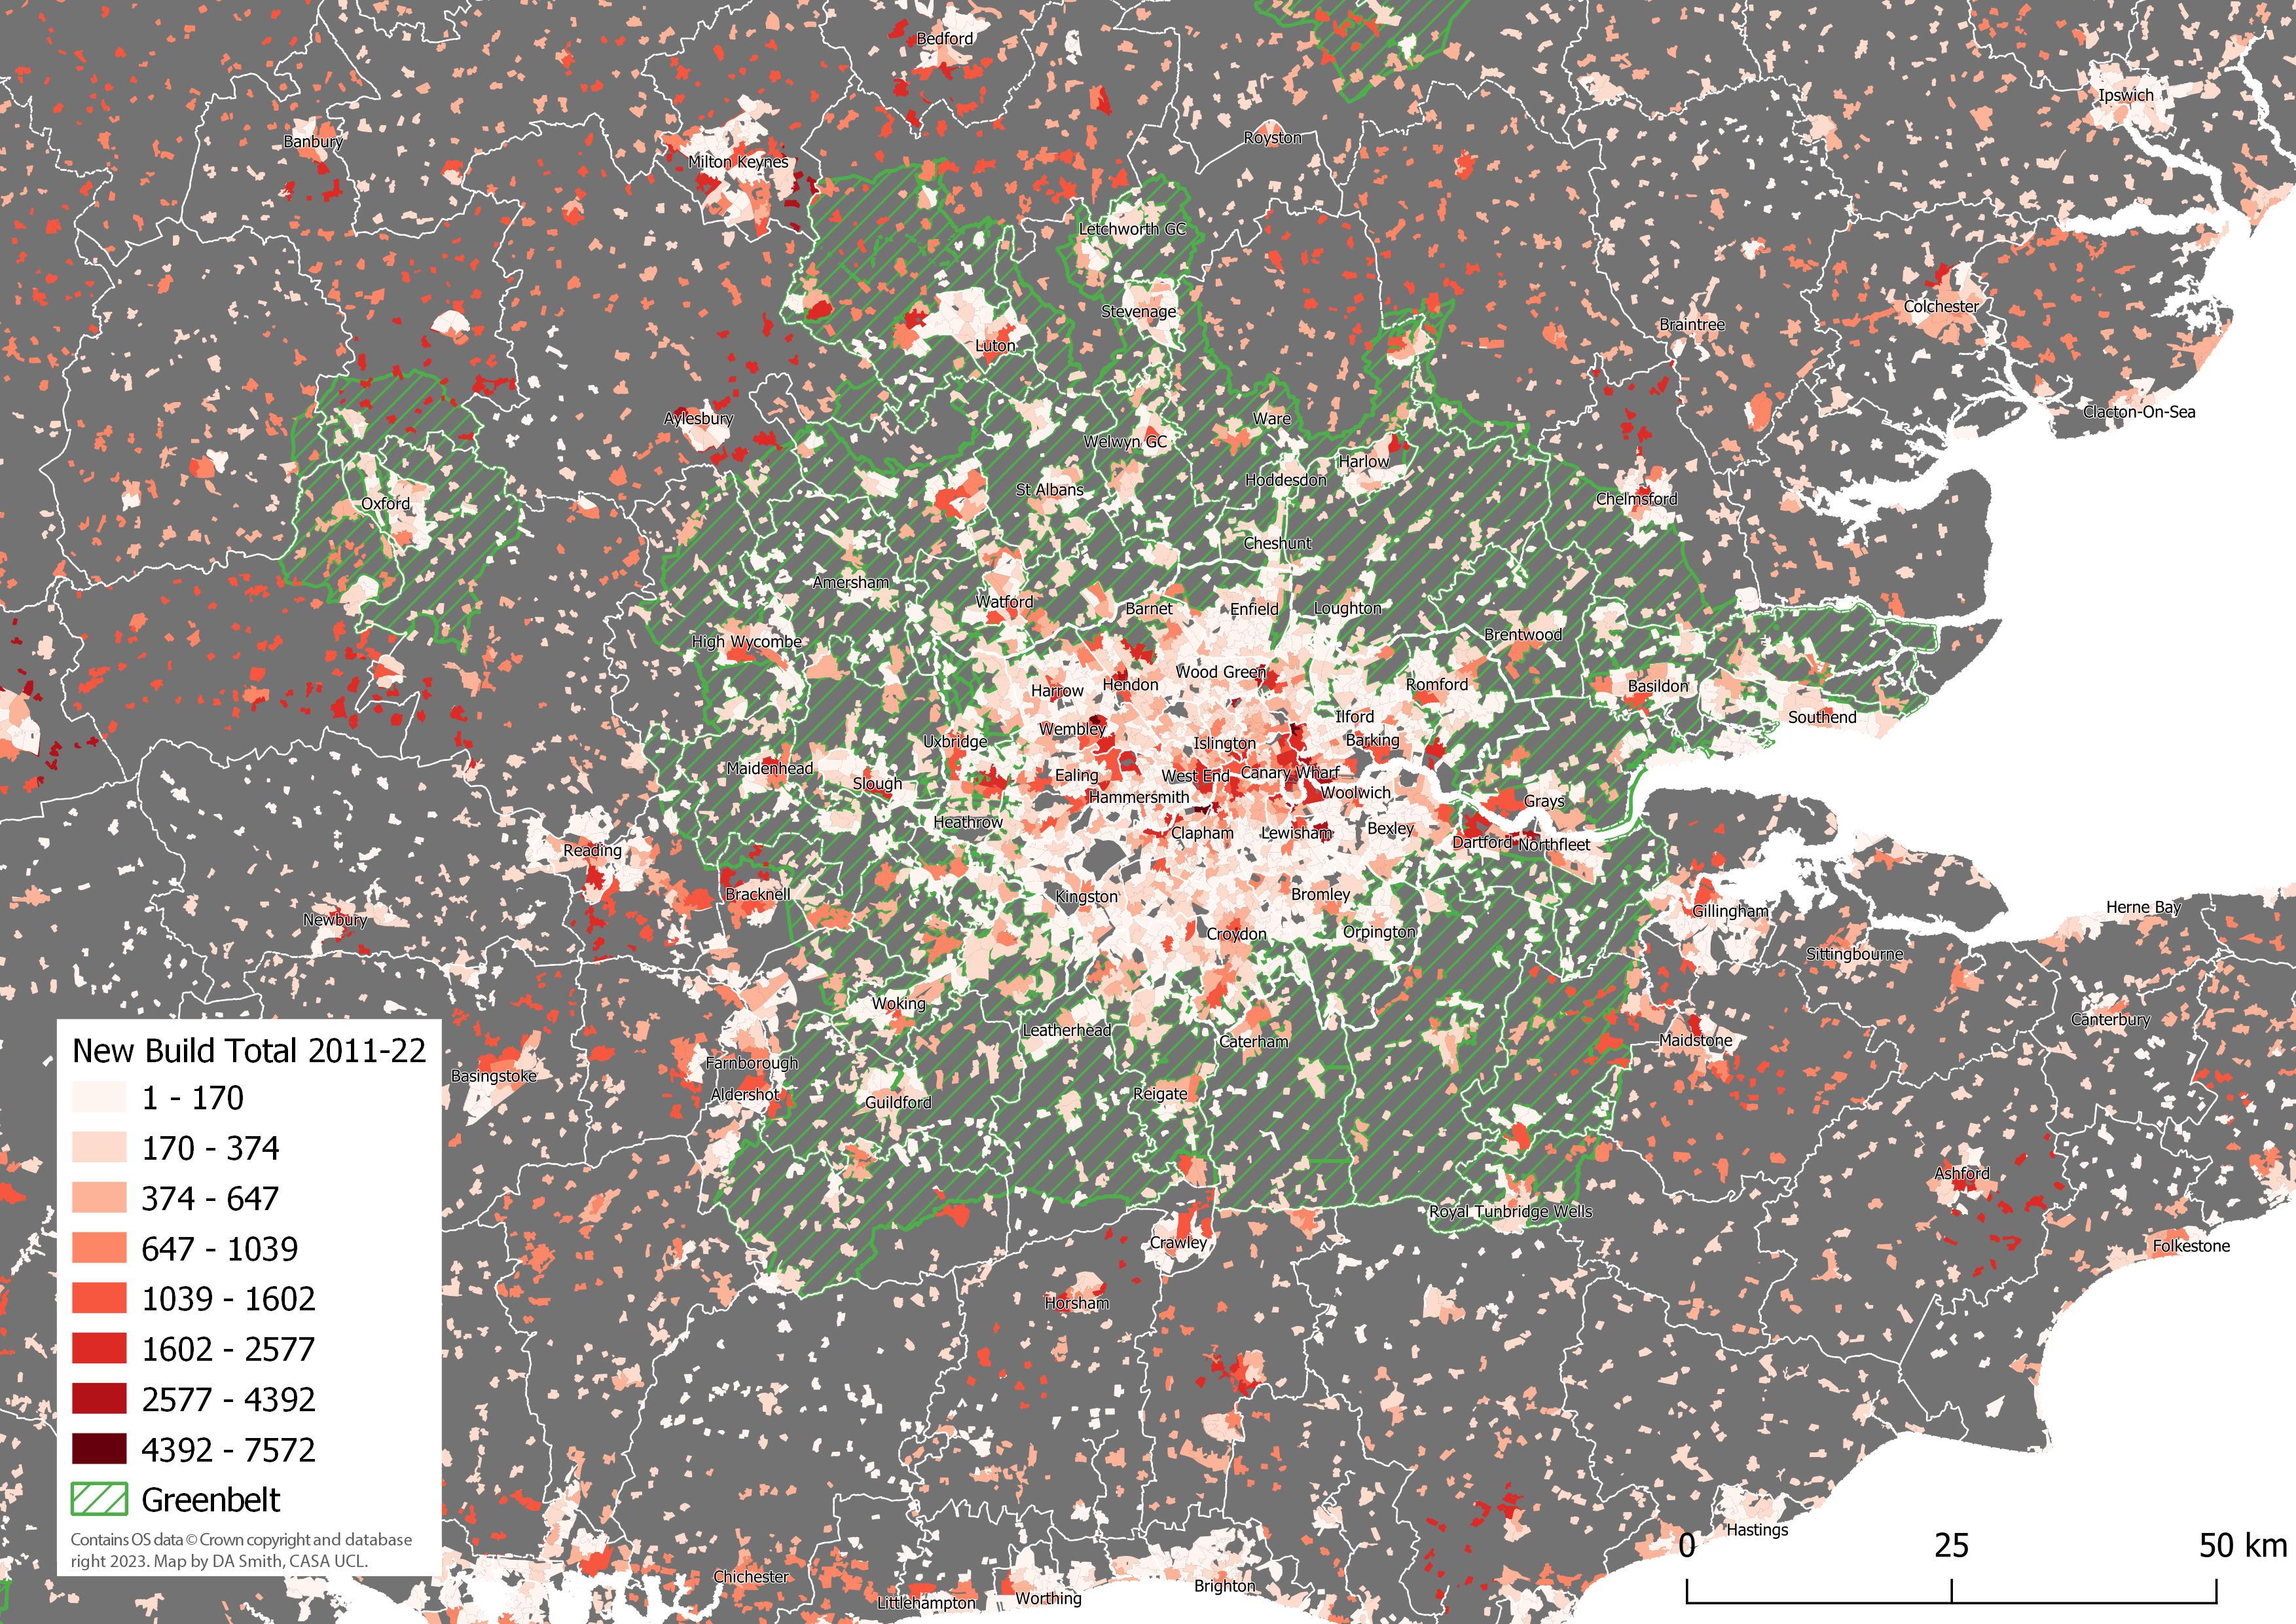
One final impact of the Green Belt can be seen by mapping development in the last decade as shown below. In addition to the patterns of high development in Opportunity Area sites, and generally low development in the Green Belt, there is a ring of high development activity just beyond the Green Belt boundary. This ring includes dispersed car-dependent development in semi-rural areas, and the expansion of medium-sized towns and cities such as Milton Keynes and Reading. This pattern looks very much like Green Belt restrictions are pushing development beyond the Green Belt boundary, creating sprawl-type patterns in several authorities. One important caveat is that several South East cities have strong economies in their own right, particularly technology industries in the Oxford-Milton Keynes-Cambridge arc, creating local development demands in addition to London-linked demand.
Potential for Green Belt Reform
With Greater London consistently falling short of housing targets, reform of the Green Belt has been cited as a promising solution (see for example Mace, 2017; Cheshire and Buyuklieva, 2019). The release of Green Belt land could greatly boost development and ease prices. Green Belt reform could also be a substantial source of revenue for austerity-hit local authorities, if authorities are given the powers to purchase Green Belt land at current use value and benefit from the land value uplift (this is part of the Labour proposals).
Traditional objections to Green Belt development focus on rural land preservation. Yet the Green Belt is massive in scale – 12.5% of all the land in England is Green Belt. London’s Green Belt is 5,085km2, or three times bigger than Greater London. Medium density housing development would take up a small proportion of this land. For example, building 100k dwellings at a gross density of 40 dwellings per hectare would add up to 25km2, or less than 0.5% of the London region’s Green Belt. Appropriate Green Belt reform could simultaneously allow for a moderate increase in development and improve environmental aspects of the Green Belt – the current environmental record of the Green Belt is mediocre on key measures such as biodiversity – through green infrastructure funding and principles of Net Biodiversity Gain. The land preservation arguments against Green Belt development do appear to be solvable. There are however further sustainability impacts from housing development to consider, including transportation and housing energy impacts, as discussed below.
Sustainability Impacts- Travel
Transport is the largest source of GHG emissions in the UK – 26% of all emissions in the latest 2021 data (DBEIS, 2023). The route to Net Zero requires both the electrification of transport systems and a significant mode shift from private cars to public transport, walking and cycling (HM Government, 2021). Greater London is a UK leader in sustainable travel, but this is not the case for the wider London region, much of which is car dependent. The analysis here uses car ownership and commuting mode choice data from the 2021 census to create a Travel Sustainability Index, as shown in the table below, which classifies Greater South East residents into 6 travel classes of around 4 million people. The South East covers a very wide range of travel behaviours, from an average of 20% commuting by car and 62% zero car households in the most sustainable class 1; to as high as 87% car commuting and 6% zero car households in the most car-dependent class 6.
Travel Sustainability Classes Average Statistics (2021 Census data)
| Travel Sustainability Class | Travel Sustain. Index | Car Commute % | Public Transport Commute % | Walk & Cycle Commute % | Car Owning Households % | Residential Net Density (pp/km2) | Total Pop. in South East |
| 1 | 45-82 | 20.3 | 48.5 | 26.4 | 38.3 | 51.5k | 3.56m |
| 2 | 30-45 | 41.6 | 33.2 | 20.9 | 61.5 | 32.1k | 4.03m |
| 3 | 21-30 | 60.6 | 18.1 | 17.6 | 74.7 | 25.0k | 4.03m |
| 4 | 15-21 | 71.6 | 10.9 | 14.2 | 83.3 | 20.2k | 4.16m |
| 5 | 10-15 | 80.0 | 6.5 | 10.9 | 89.4 | 16.4k | 4.34m |
| 6 | 1-10 | 87.3 | 3.6 | 6.7 | 94.1 | 11.1k | 4.29m |
Mapping the travel sustainability classes highlights the stark travel behaviour differences between Greater London and the wider region. The Inner London population-weighted average travel sustainability score is 51.6 (class 1), and Outer London is 32.1 (class 2). The Green Belt is overwhelmingly in car dependent classes 4 and 5, with an overall population-weighted average of 16.4 (class 4). The Rest of the South East has a population-weighted average score nearly identical to the Green Belt at 16.5, emphasising the disappointing levels of car dependence in the Green Belt despite its rail infrastructure and proximity to London.

The patterns shown in the above map clearly present a challenge for Green Belt development, as new housing in the wider region risks extending patterns of car dependence. Car dependent areas include some locations next to rail stations (proximity to rail stations has been advocated as a criteria for prioritising Green Belt land for housing). We can directly measure the travel sustainability of housing development from the last ten years by matching the output areas locations of new housing to the Travel Sustainability Index scores. This is shown in the scatterplot below, where Inner London boroughs score highly with this measure, followed by Outer London. Much of the housing development in the wider region scores poorly in terms of travel sustainability, including in areas with high housing development such as Bedfordshire and Milton Keynes.

Although travel sustainability is generally low in the wider region, there are trends identifiable in the above results that can be used as basis for guiding more sustainable development. Several towns and cities show moderately sustainable travel outcomes, including the Green Belt towns Luton, Watford, Guildford and Southend, and wider South East towns and cities Brighton, Reading, Oxford, Cambridge, Portsmouth, Norwich and Southampton. Generally, development in existing towns and cities is likely to be more sustainable than developing smaller settlements and more dispersed rural areas. There are also noticeably better results in active travel-oriented cities such as Brighton and Cambridge. Overall, if we want Green Belt housing development to minimise travel sustainability impacts, then it would be most realistic to achieve this by extending existing towns and cities, both within the Green Belt and in the wider South East. Promoting development in Outer London boroughs also looks to be an efficient strategy given generally good travel sustainability levels in Outer London, and that Outer London is 27% Green Belt land.
Sustainability Impacts- Energy
Another important sustainability impact of new build is energy use and carbon emissions resulting from space and water heating, which we can estimate from the Energy Performance Certificate data as shown below. CO2 emissions per dwelling are considerably lower in Inner and Outer London, with overall London emissions per dwelling around two thirds of the value for the Green Belt and Rest of the South East. This is only partly due to smaller dwelling sizes, as CO2 emissions per square metre in London are significantly lower as well. The lower emissions in London housing can be explained by the much higher proportion of flats and also the use of community/district heating, with three quarters of all new build in Inner London and 47% of new build in Outer London connected to community heating networks. The community heating approach is only efficient for high density developments. For medium and lower density developments, air and ground source heat pump technologies are a key technology for improving energy efficiency and replacing gas boilers. The statistics from 2011-22 are very disappointing on this front, at 4% of new build with heat pumps in the Green Belt and 6% in the Wider South East.
New Build Annual Average CO2 Emissions and Energy Summary 2011-2022 (Data: EPC 2023)
| Subregion | CO2 per Dwelling (tonnes) | CO2 per m2 (kg) | Energy Consumption (kWh/m2) | Community Heating % | Heat Pump % (air + ground) |
| Inner London | 0.93 | 12.9 | 72.9 | 75.2 | 2.7 |
| Outer London | 1.04 | 15.3 | 87.2 | 46.9 | 2.8 |
| Green Belt | 1.60 | 18.7 | 106.9 | 7.9 | 3.5 |
| Rest of South East | 1.53 | 17.2 | 97.7 | 5.7 | 5.9 |
| All Subregions | 1.34 | 16.3 | 92.5 | 27.0 | 4.3 |
The average annual CO2 emissions by dwelling are summarised at the local authority level in Figure 19 (note y axis starts at 0.5). Similar to the travel sustainability results, London boroughs have considerably more sustainable results. Town centres in the South East again are the best performing outside of London, including Cambridge, Southampton, Eastleigh, Reading, Luton, Watford, Woking and Dartford. As the chart shows average CO2 per dwelling, there is a connection between affluence and dwelling size, with higher income boroughs such as Richmond Upon Thames and particularly Kensington and Chelsea, having high emissions. Overall however, energy efficiency is much better in London boroughs and this is a further challenge for the sustainability of Green Belt development. Similar to the travel sustainability analysis, the results point to the extension of existing towns and cities, and Outer London development, as the most sustainable development strategies.

Summary
There is a widespread consensus that London needs to build more housing to meet demand and try to reduce record levels of unaffordability. Yet London has been consistently short of meeting housing targets for the last decade, despite substantial growth in Inner London. Green Belt restrictions do appear to have played a major role in constraining development, with low levels of new build in Green Belt local authorities, and in Outer London boroughs with extensive Green Belt land. There is also a significant price premium in Green Belt areas compared to the wider South East.
This analysis agrees with research advocating Green Belt reform. Travel sustainability conditions are needed to avoid this reform producing highly car dependent housing, such as has been occurring in Central Bedfordshire and Milton Keynes (where the East-West should have been built much earlier). Pedestrian access to rail stations is a sensible starting point for prioritising Green Belt land for housing, but it is not sufficient to produce sustainable travel outcomes in the Green Belt. The aim should be for new housing to have local access to a range of services (e.g. retail, schools), providing sustainable travel options for multiple trip types. Another related issue is the need for more sustainable energy efficiency measures in medium density new build housing. There is little evidence in the EPC data for adoption of key housing technologies such as heat-pumps and solar PV. Widespread adoption of these technologies is needed for sustainable development at scale in the Green Belt. Other studies have also identified poor design and planning in new build housing in the UK (see Carmona et al., 2020), and this needs to change as part of any plan to increase the volume of new housing.
Green Belt reform would have to come from national government, changing the very restrictive current National Planning Policy Framework to allow authorities with housing shortages to develop Green Belt land of low environmental quality near services, and to use land value uplift to fund services and affordable housing. It would be logical to give powers to the GLA (and other combined authorities) for the strategic coordination of this development within their boundaries, given the GLA’s strong track record on sustainable housing delivery. It is difficult however to envisage large scale change happening in the South East without national government also organising improved regional coordination and planning. This analysis identifies better travel sustainability outcomes for new build in larger towns and cities in the South East, and supports the urban extension model for development in the Green Belt. There are many candidate towns in London’s Green Belt for urban extensions, including Luton, Guildford, Watford, Maidenhead, Hemel Hempstead, Chelmsford, Basildon, Reigate and Harlow. This larger scale solution is politically more challenging, and would again require leadership and coordination from national government.
—————————–
Read the full CASA Working Paper.
This research is part of the ESRC / JPI Europe SIMETRI Project.