The Census is the most comprehensive demographic survey in the UK, providing detailed data for government and researchers in many fields, from health and education, to planning and transport. The 2021 Census has a unique context, as the 2021 census day (21st March 2021) occurred when the UK was still in the 3rd national lockdown which began on the 6th of January 2021. The lockdown will likely have various impacts on the census results, particularly on groups who may have changed their residence during lockdown, such as students (many of whom were studying remotely) and employees in the hardest hit sectors, such as retail, arts and hospitality.
The issue is not that the census will be inaccurate per se (indeed the Census has a very thorough survey methodology) but rather that the period in time captured of March 2021 will have aspects unique to the pandemic. These aspects are likely to be temporary as society returns to something more like normality in 2022 and beyond. While Scotland chose to delay its 2021 census for a year (which may prove to be a sensible decision), researchers in England and Wales will need to be make the most of the 2021 results and be made aware of any unusual aspects.
At present only the early population results have been released for the 2021 Census, so more detailed breakdowns of population groups will have to wait for further releases later this year. The following analysis compares the Census 2021 local authority totals to the ONS mid-year population estimates for 2020 to check how the census population results compare to the next most recent population estimate.
The differences between the 2020 data and 2021 Census are likely to reflect several factors-
- The higher accuracy of the census methodology. The ONS mid-year estimates can have some errors due to limited data on some groups, such as international migrants, which are better represented in the census. Potentially Brexit could have increased the degree of error in the mid-year estimates, given changes in international migration.
- Temporary pandemic changes to places of residence. These could include for example students working remotely from home during term time (including international students not coming to the UK), younger populations returning to live with parents as jobs furloughed/ended/changed to remote working, and wealthier residents choosing to live in second homes.
- Longer term pandemic changes to residential preferences. This could reflect changing residential preferences towards larger houses with more space/gardens following a dramatic rise in remote working during the pandemic.
Right now the extent of these different factors is not known, and it is very difficult to separate them without more analysis and data. So the following discussion is speculative in nature.
Comparing the Census 2021 Populations to the 2020 ONS Mid-Year Estimates
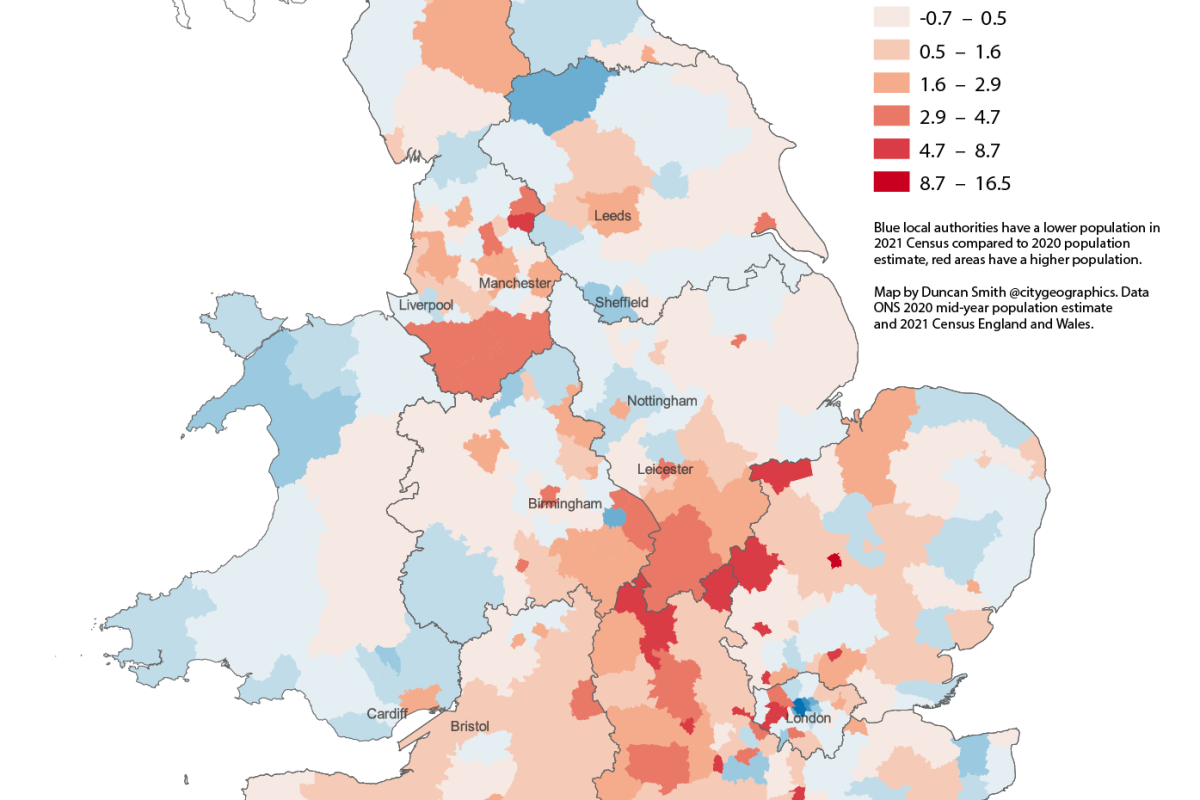
The map below shows the percentage differences between the 2020 mid-year population estimates, and the 2021 Census. Blue areas show where the census 2021 population is lower than the 2020 estimates, and red areas where the census 2021 population is higher than the 2020 estimates. The differences are substantial. In South East England there is a strong geographical pattern with Inner London populations down dramatically (Camden and Westminster both have 24% lower populations in the census results). London as a whole has a population of 8.8 million in the 2021 census, which is 200k lower than the estimated 2020 total. In contrast, commuter towns and the home counties surrounding London have distinctly higher populations of around 5-10%. This pattern very much looks like a pandemic geography of Inner London residents leaving during the lockdown. Analysis by the GLA using PAYE income data confirms this general conclusion, and also points to this population drop being concentrated in young adults (note also the GLA analysis shows this population largely returning to Inner London by 2022). It is possible however that other factors such as post-Brexit emigration and very high rents are also reducing Inner London populations, and could have produced errors in the 2020 mid-year estimate data.

It is not just in the South East where there are differences between the 2020 and 2021 data. The South West and the Midlands are also areas where generally 2021 Census populations are higher than the 2020 data. The higher populations are mainly in more rural authorities, as well as some urban areas including Leicester, Lincoln, Derby, Worcester and Swindon, while Coventry and Nottingham have lower 2021 populations (university related?). There is no simple pattern here, and there are likely some 2020 mid-year population errors here in addition to any pandemic related changes. There also appear to be higher populations in areas within 1-2 hour journey times to London, possibly linked to changing residential preferences following the rise in flexible working.
North-West England has a mixed pattern with higher census populations in Cheshire to the South and in Burnley, but not in central Manchester or Liverpool. In Yorkshire and Humberside, Leeds and Hull have higher populations in the 2021 Census, while Sheffield is lower. The North East and Wales generally have a much closer alignment between the 2020 and 2021 data. The higher than expected populations in many rural and smaller town authorities fits with pandemic related patterns, but the mixed picture for many cities implies that the situation is complex, and may include both pandemic changes and errors in the 2020 data.
London and the South East
As mentioned above, the 2021 Census data for London and the South East does look to have been significantly influenced by the pandemic, with much lower than expected populations in Inner London, and higher populations in towns surrounding Greater London, and those with longer distance rail connections, such as Peterborough, Milton Keynes and Reading. We can look in more detail at some of these patterns.
As well as higher populations in commuter towns surrounding London, there are also higher population results recorded in the Outer West London boroughs of Ealing and Hounslow. This is quite an outlier compared to the rest of Greater London, and it is not clear why pandemic or mid-year population error factors would affect these boroughs in particular. In relation to the student population argument, it is interesting that both Oxford and Cambridge have higher than expected 2021 Census populations, likely because Oxbridge colleges insisted on students being on campus in 2021, and likely because the 2020 data has underpredicted wider population increases.

The big question on the geography of the South East is to what extent these pandemic related changes are a temporary lockdown phenomena, or may relate to longer term trends in residential preferences. The analysis by the GLA using PAYE data pointed to the population decreases in Inner London being a short term trend for younger adults, which in turn could have pushed up populations in the wider South East in 2021. However, an argument can also be made that some of the patterns observed fit trends of households looking for more spacious residences, and adapting to flexible working patterns that do not require daily attendance at the office. Areas beyond 1 hour travel to London with more affordable housing become much more attractive in this context (and have seen big house price increases). The map above shows a ring of local authorities surrounding London with higher than expected populations in 2021 that stretches beyond the South East into the Midlands and South West. We will need to wait for more data to see whether this is a trend beyond the immediate residential changes during the pandemic.
Age Profile Comparison, 2011 and 2021
In the comparison above, it is very difficult to separate out errors in the mid-year estimates from genuine population changes. Another approach is to look at the age profiles in 2011 and 2021 for those areas with significant population differences in the 2021 census. Firstly for Inner London boroughs with lower than expected populations, you can see very clearly in the charts for Westminster and Camden that the lower populations are focussed on younger adults, 20-40. This fits with the temporary pandemic residential changes argument. There are however other factors aside from the pandemic, such as increased rents and post-Brexit visa issues, that could also lower the population of younger adults.


For London as a whole, there is a modest drop in the population in their 20s, and increase in nearly all other age groups, with the average age increasing overall. The comparison between the 2020 population data with the 2021 census above did not pick up unexpectedly lower populations in other large English cities apart from London. Looking at other English cities in terms of age profiles, generally there does not appear to be this fall in the proportion of younger adults. Leeds is a fairly typical example shown below. Manchester on the other hand has a pattern a bit more like London, and perhaps this signals more pandemic related changes here, or maybe more similarity to London in terms of international migration.


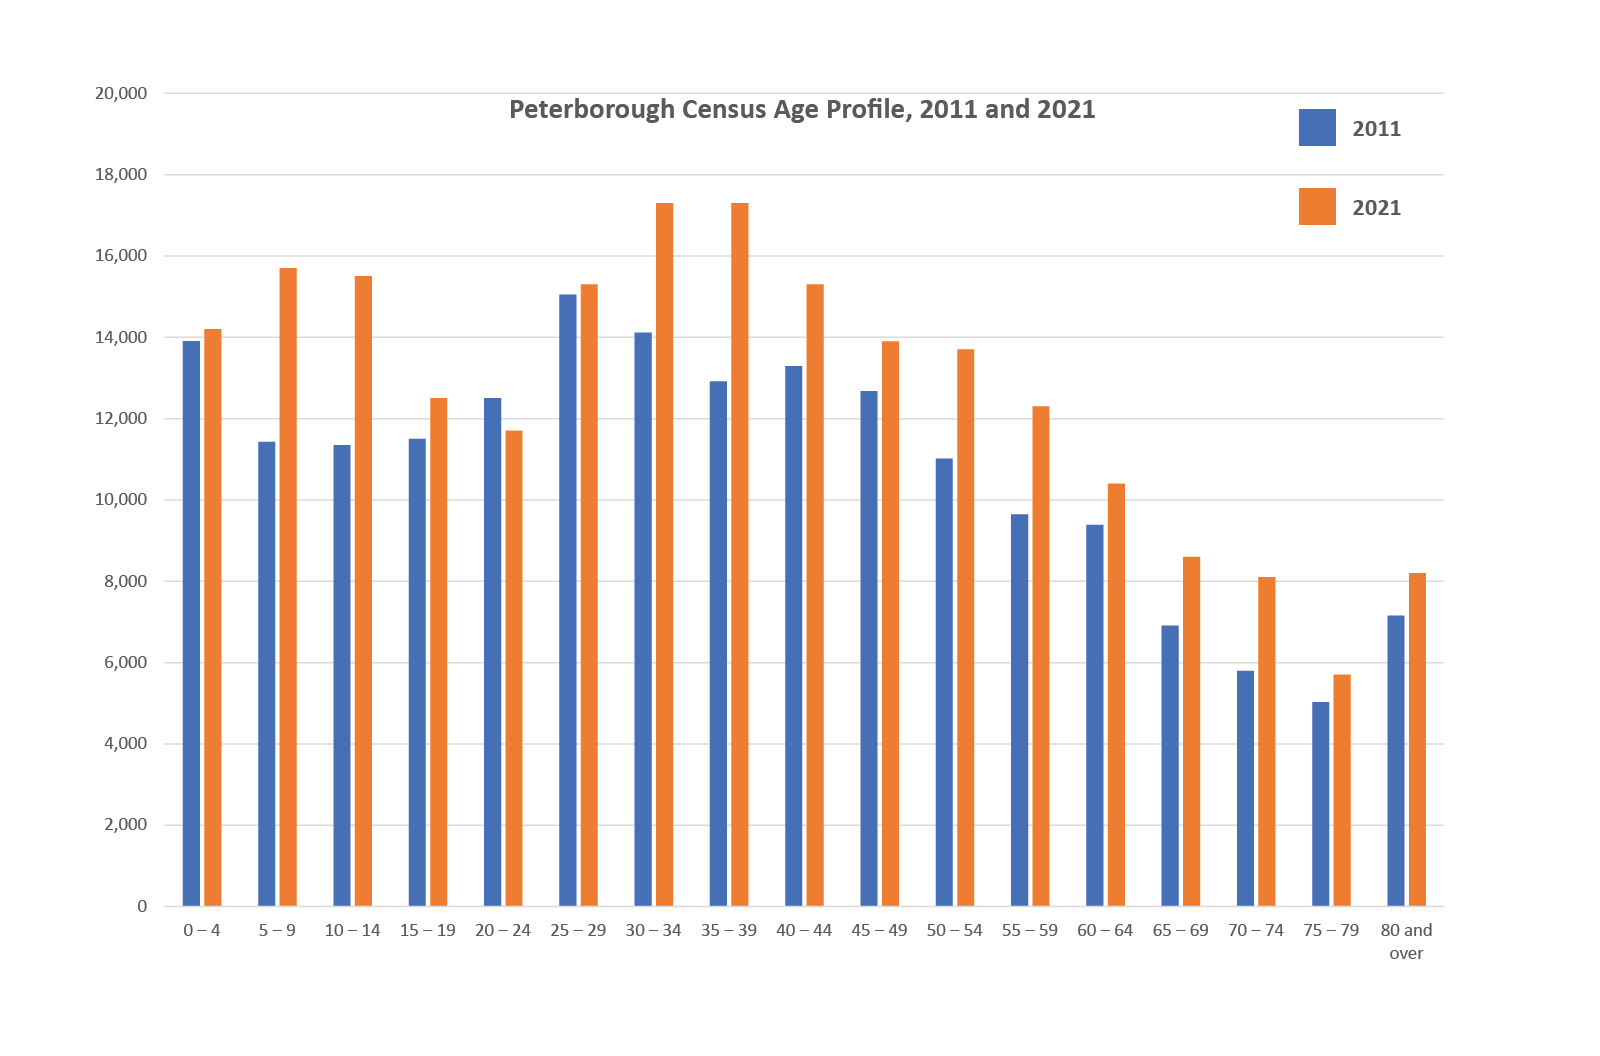
Turning to those cities with higher than expected population increases in the 2021 census, we can also look at their age profiles. The examples below of Peterborough and Milton Keynes show really big increases in populations in their 30s and to a lesser extent 40s. Many of these households will have kids, and so there are similar jumps in the population of young children (though this does not appear in the age 0-4 group). This pattern looks very much like these towns are attracting families looking for more affordable housing, and the 2020 data has underestimated this trend. It is possible the pandemic has further encouraged this, but it looks overall like a longer term trend. Note that other towns growing rapidly in the South East such as Reading and Bedford has similar age profile charts (as does Ealing in London). The big outlier is Cambridge, where the population increase is geared more towards adults in their 20s.

Summary
This analysis has found some significant differences between the new 2021 census data, and mid-year population estimate data from 2020. It is very difficult to know whether this is due to errors in the 2020 data, or alternatively pandemic factors affecting the population in March 2021. Some of the biggest differences are in London, and it does appear that London experienced a drop in the younger adult population during the pandemic, particularly in Inner London. Manchester also has signs of a similar trend. GLA analysis indicates this drop was temporary in London, though there are longer term factors such as high rents which could also be playing a role.
Another big difference between the 2020 and 2021 data is much faster growth in many towns and small cities in the South East. Places like Milton Keynes and Bedford have growth of around 17% between 2011 and 2021. The age profile data shows this is driven mainly by adults in their 30s and 40s, often with children. The population differences look more like errors in the 2020 data here, though it is possible that the pandemic has accelerated families moving to more affordable towns to purchase larger housing.
Overall is not straightforward to separate out errors in the ONS mid-year estimates from pandemic changes, or to separate temporary pandemic changes from any longer term trends that are emerging. When the full data is released it will likely be possible to filter out certain demographics (e.g. students, younger populations) more affected by the pandemic. But it does look like the census 2021 data is going to be less certain than usual, particularly for London, and maybe for other large cities. Given that the census is traditionally used as a basis for investment in public services, more caution will be needed when using the 2021 census results (indeed London Councils have already responded that the 2021 census is underpredicting London’s population).
Table of Local Authorities with Greatest Increases Between 2020 ONS and 2021 Census Populations
| Name | 2011 Census Population | 2020 Mid-year Population | 2021 Census Population | Population Change 2011-2020 | Population Change 2011-2021 | Difference Between 2020 ONS and 2021 Census |
|---|---|---|---|---|---|---|
| Cambridge | 123867 | 125063 | 145700 | 1.9 | 17.6 | 16.5 |
| Reading | 155698 | 160337 | 174200 | 3.2 | 11.9 | 8.6 |
| Ealing | 338449 | 340341 | 367100 | 0.3 | 8.5 | 7.9 |
| Oxford | 151906 | 151584 | 162100 | 0.9 | 6.7 | 6.9 |
| Harlow | 81944 | 87280 | 93300 | 6.2 | 13.9 | 6.9 |
| Peterborough | 183631 | 202626 | 215700 | 9.8 | 17.5 | 6.5 |
| Milton Keynes | 248821 | 270203 | 287000 | 8.1 | 15.3 | 6.2 |
| Bedford | 157479 | 174687 | 185300 | 10.7 | 17.7 | 6.1 |
| Hounslow | 253957 | 271767 | 288200 | 6.6 | 13.5 | 6.0 |
| Cherwell | 141868 | 151846 | 161000 | 6.7 | 13.5 | 6.0 |
| Burnley | 87059 | 89344 | 94700 | 2.7 | 8.8 | 6.0 |
| Slough | 140205 | 149577 | 158500 | 6.3 | 13.0 | 6.0 |
| Watford | 90301 | 96623 | 102300 | 6.6 | 13.3 | 5.9 |
| Rushmoor | 93807 | 94387 | 99800 | 0.0 | 6.4 | 5.7 |
| Luton | 203201 | 213528 | 225300 | 4.9 | 10.9 | 5.5 |
| Crawley | 106597 | 112474 | 118500 | 5.1 | 11.2 | 5.4 |
| Swindon | 209156 | 222881 | 233400 | 6.3 | 11.6 | 4.7 |
| West Northampton. | 375101 | 406733 | 425700 | 8.2 | 13.5 | 4.7 |
| Merton | 199693 | 206453 | 215200 | 2.9 | 7.8 | 4.2 |
| Basingstoke and Deane | 167799 | 177760 | 185200 | 5.5 | 10.4 | 4.2 |
| Leicester | 329839 | 354036 | 368600 | 7.4 | 11.8 | 4.1 |
| Pendle | 89452 | 92145 | 95800 | 2.9 | 7.1 | 4.0 |
Table of Local Authorities with Greatest Decreases Between 2020 ONS and 2021 Census Populations
| Name | 2011 Census Population | 2020 Mid-year Population | 2021 Census Population | Population Change 2011-2020 | Population Change 2011-2021 | Difference Between 2020 ONS and 2021 Census |
|---|---|---|---|---|---|---|
| Camden | 220338 | 279516 | 210100 | 27.0 | -4.6 | -24.8 |
| Westminster | 219396 | 269848 | 204300 | 22.9 | -6.9 | -24.3 |
| City of London | 7375 | 10938 | 8600 | 47.6 | 16.6 | -21.4 |
| Islington | 206125 | 248115 | 216600 | 20.3 | 5.1 | -12.7 |
| Coventry | 316960 | 379387 | 345300 | 19.7 | 8.9 | -9.0 |
| Kensington and Chelsea | 158649 | 156864 | 143400 | -0.9 | -9.6 | -8.6 |
| Hackney | 246270 | 280941 | 259200 | 13.7 | 5.3 | -7.7 |
| Richmondshire | 51965 | 53732 | 49700 | 0.8 | -4.4 | -7.5 |
| Tower Hamlets | 254096 | 331969 | 310300 | 29.7 | 22.1 | -6.5 |
| Kingston upon Thames | 160060 | 179142 | 168000 | 11.7 | 5.0 | -6.2 |
| Gwynedd | 121874 | 125171 | 117400 | 3.0 | -3.7 | -6.2 |
| Isles of Scilly | 2203 | 2226 | 2100 | 0.1 | -4.7 | -5.7 |
| Canterbury | 151145 | 166762 | 157400 | 10.7 | 4.1 | -5.6 |
| Sheffield | 552698 | 589214 | 556500 | 6.8 | 0.7 | -5.6 |
| Brighton and Hove | 273369 | 291738 | 277200 | 6.9 | 1.4 | -5.0 |
| Newcastle-under-Lyme | 123871 | 129610 | 123300 | 4.6 | -0.5 | -4.9 |
| Guildford | 137183 | 150352 | 143600 | 9.3 | 4.7 | -4.5 |
| Blaenau Gwent | 69814 | 70020 | 66900 | 0.3 | -4.2 | -4.5 |
| Nottingham | 305680 | 337098 | 323700 | 10.9 | 5.9 | -4.0 |
