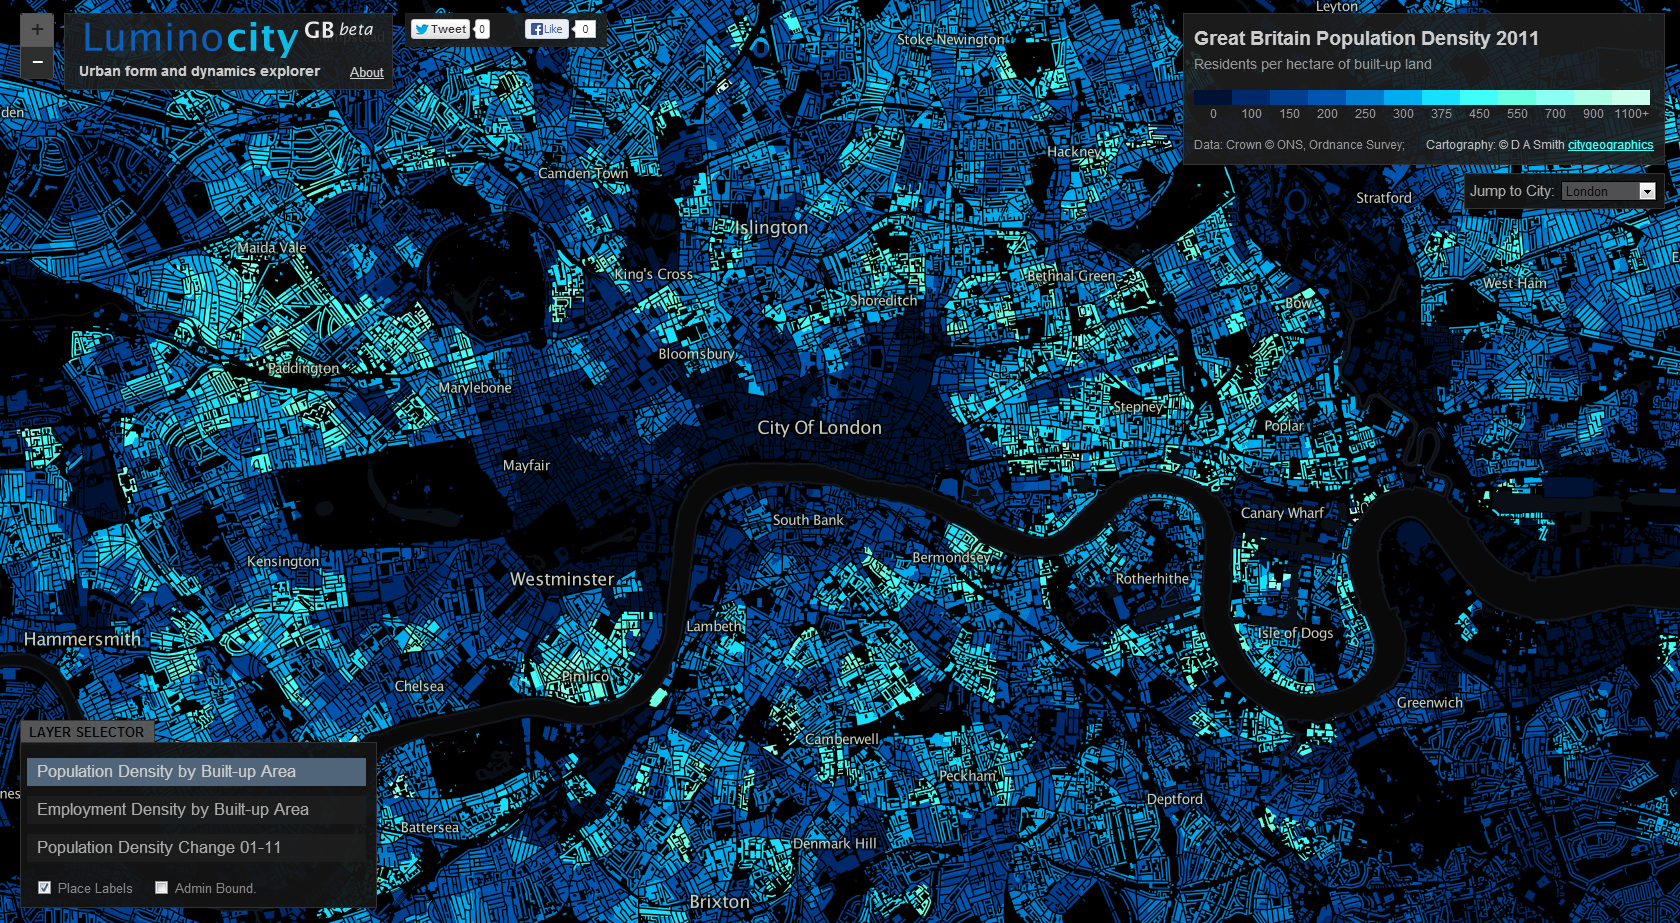
It’s been 14 years since the landmark Urban Task Force report, which set the agenda for inner-city densification and brownfield regeneration in the UK. Furthermore we’ve seen significant economic and demographic change in the last decade that’s greatly impacted urban areas. We can now use the 2011 census data, mapped here on the LuminoCity GB site, to investigate how these policies and socio-economic trends have transformed British cities in terms of population density change.
The stand-out result is that there’s a striking similarity across a wide range of cities, with overall growth achieved through high levels of inner-city densification (shown in lighter blue to cyan colours) in combination with a mix of slowly growing and moderately declining suburbs (dark purple to magenta colours).

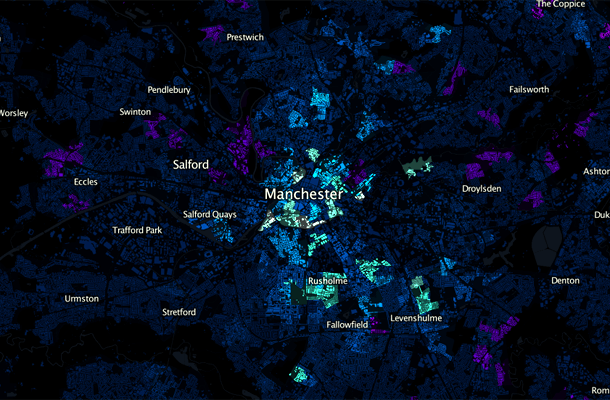


We can see this pattern in the growing urban regions of Manchester, Birmingham, Leeds and Sheffield above. Manchester has the fastest population growth after London, with 8.1% growth in the city-region, and a massive 28% growth in the core local authority. Average densities in Manchester have gone up by 28% (+35 residents per hectare), but it’s not a uniform growth. There are new development sites at a very high 300 or 400 residents per hectare, contrasting with low density surrounds and the extensive remaining brownfield sites. There is a patchy nature to the current urban fabric of Manchester, indicating that much further development could still take place.
The West Midlands Conurbation is the third fastest growing city-region at 7.3%, with a higher 10% growth in the core city authority Birmingham. Density increases are more modest here (+13 residents per hectare) but the same general pattern remains. Similar patterns of high density inner-city growth are also clear in Leeds (5% growth) and Sheffield (8% growth).
The trend applies to medium size cities also. Those cities with the highest growth rates like Leicester (+18%), Nottingham (+14%), Cardiff (+13%) and Bristol (+12.5%) show fewer signs of suburban depopulation-


Scottish cities have a stronger tradition of high density inner-city living. With compact cores already in place, Edinburgh (+6.5%) and Aberdeen (+5%) have been expanding the inner city into Leith and Old Aberdeen-


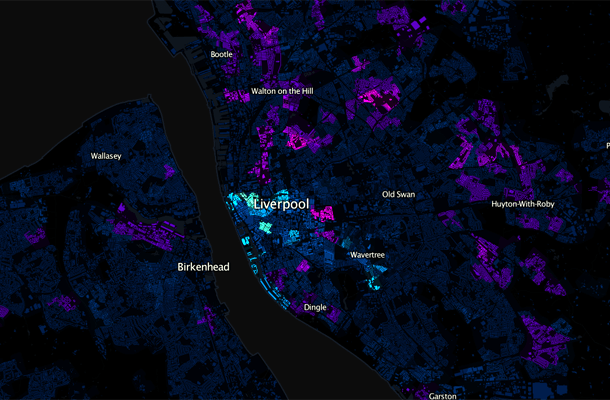
Meanwhile the UK’s former industrial powerhouses of Glasgow, Liverpool and Newcastle display a more problematic variation on this pattern. City centre intensification is still much in evidence, with core city authority populations growing at 8% in Newcastle, 6% in Liverpool and 4% in Glasgow. But this growth is in combination with outright decline in some surrounding towns and suburban areas, particularly around Glasgow. These patterns are linked to major programmes to overhaul poor inner-city housing stock, but are also inevitably linked to weaker economic growth in Glasgow and Liverpool. The picture is better in Tyne & Wear, where there are more positive employment signs (8% growth in workforce jobs 2001-2011).


What is driving this urban dynamic?
In addition to planning policy shifts, a series of economic and demographic changes are contributing to the pattern of central growth and struggling suburbs, as commentators have variously been observing in the UK and US (e.g. gentrification researchers, Erenhalt, Kochan). Demographic aspects include more students, immigrants, singles and childless couples. Economic aspects include city-centre friendly service and knowledge economy jobs, as well as increased costs of petrol. For these trends to occur over a wide range of demographically and economically diverse cities in the UK and beyond, clearly there are multiple factors pulling urban populations and growth in similar directions.
London Extremes
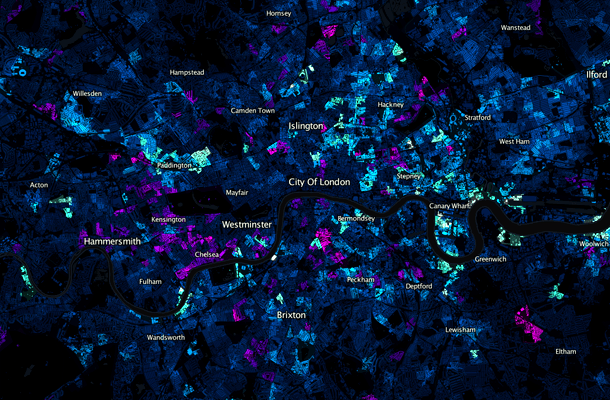
We’ve avoided the gigantic outlier of London so far. It’s a city apart in many ways- much larger (8.1 million in the GLA area) and faster growing (+14% 2001-2011). It’s also massively higher density, with average residents per hectare 50% higher (nearly 200 residents per hectare) than the next most dense city-region in GB. The biggest changes have been in Inner East London. Tower Hamlets (where Canary Wharf has boomed) is 1st on every indicator- highest population change (+28.8%), highest employment change (+50%!!), highest population density (324 residents / hectare). The pressures for growth in London are so high that there is little surburban decline in population terms (although employment has been declining significantly in Outer London).

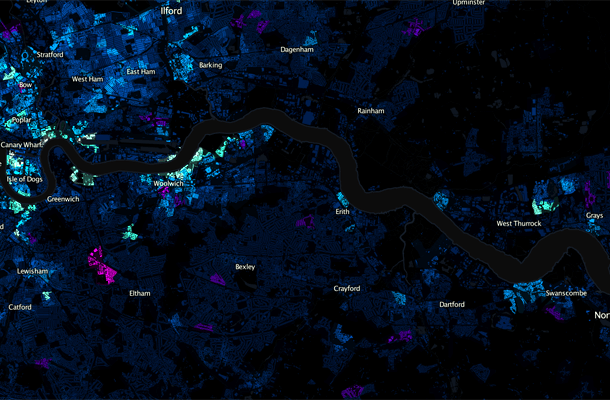
Yet the high rate of densification in London has come nowhere near meeting housing demand. London is the midst of a massive housing shortage and crisis, with some of the world’s highest property prices. The debate is currently raging about what needs to be done to accelerate construction, with advocates of transforming more land to community ownership (e.g. Planners Network UK), relaxing planning regulations such as the green belt (e.g. LSE SERC), and implementing an array of measures simultaneously (e.g. Shelter Report). We can see London’s challenges in the maps, such as the failure thus far of the flagship housing expansion programme, the Thames Gateway, to deliver. Some high profile development sites like Stratford and Kings Cross have only recently opened for residents and so do not show in the 2011 data.
Another more surprising result is the fall in the population of Inner West London, particularly Kensington and Chelsea. While this finding does need some context- K&C is still the forth most densely populated local authority in the country- it’s still an amazing trend given the extreme population pressures in London. It is in line with arguments that the most expensive properties in London have become investments for international capital rather than homes for living. Such trends push prices up, cut supply and bring questionable benefits to the city. Addressing this issue would require tax changes, and macro economic factors like the value of the pound and yields on alternative investments are also clearly influential.
Summary- an Ongoing Renaissance and Suburban Challenges
Well to state the obvious GB cities are, with only a few exceptions, growing significantly. That’s not to be sniffed at given the history of widespread urban decline throughout the second half of the 20th century. And secondly the pattern of growth in density terms is clear- densifying inner cities, and fairly static or declining suburbs. The scale of London and the severe housing crisis has it’s own unique dynamics, while Glasgow and Liverpool are still dealing with significant population loss in many areas of the city region. But on the whole, the pattern is surprisingly consistent across cities in Great Britain.
Clearly this review prompts a series of further questions analysing the economic, demographic, gentrification, deprivation and property market processes inherent in this urban change, and what future city centres and suburbs will be like. Hopefully this mapping exercise should is a useful context for the ongoing research.