The main datasets we need for our accessibility analysis are the street network – used for walking analysis from origin and destination points – and the transit schedule data in GTFS format. Additionally, we are also going to use Point of Interest data for the location of facilities we are measuring accessibility to, and a population point grid dataset of where the population in our case study city lives.
For the workshop, all these files have been prepared for you at this link. The information below describes how these datasets were produced so you can update the workshop files and model different cities. Workshop datasets–
- Montreal.zip – The data files for the Montreal model, including street network, GTFS schedules, Point of Interest data, and the compiled network.dat R5R model.
- London.zip – The data files for the Montreal model, including street network, GTFS schedules, Point of Interest data, and the compiled network.dat R5R model.
- LondonGTFS.zip – GTFS files for London, South East, East Anglia and National Rail.
- AccessibilityFiles.zip – original spatial files for the Montreal and London grid and POI data in a geodatabase.
Street Network Data
The R5 software uses OpenStreetMap data as the basis for modelling the street network. This dataset has the advantages that it is free, open and with global coverage. There are some disadvantages too, in that OSM is not rigorously validated in the same manner as a road network dataset from a national mapping agency typically is. This is generally not a big problem as the OSM data works well for most major cities. It could be an issue if you were analysing a city where the OSM data was incomplete, which is the case for some regions of the Global South.
The OSM data format we need is PBF (protocol buffer format). There are several websites where OSM PBF data can be accessed (e.g. Geofabrik OSM downloads). Protomaps is the most useful here as it allows us to easily draw a rectangle around our study area and download the selected OSM data-
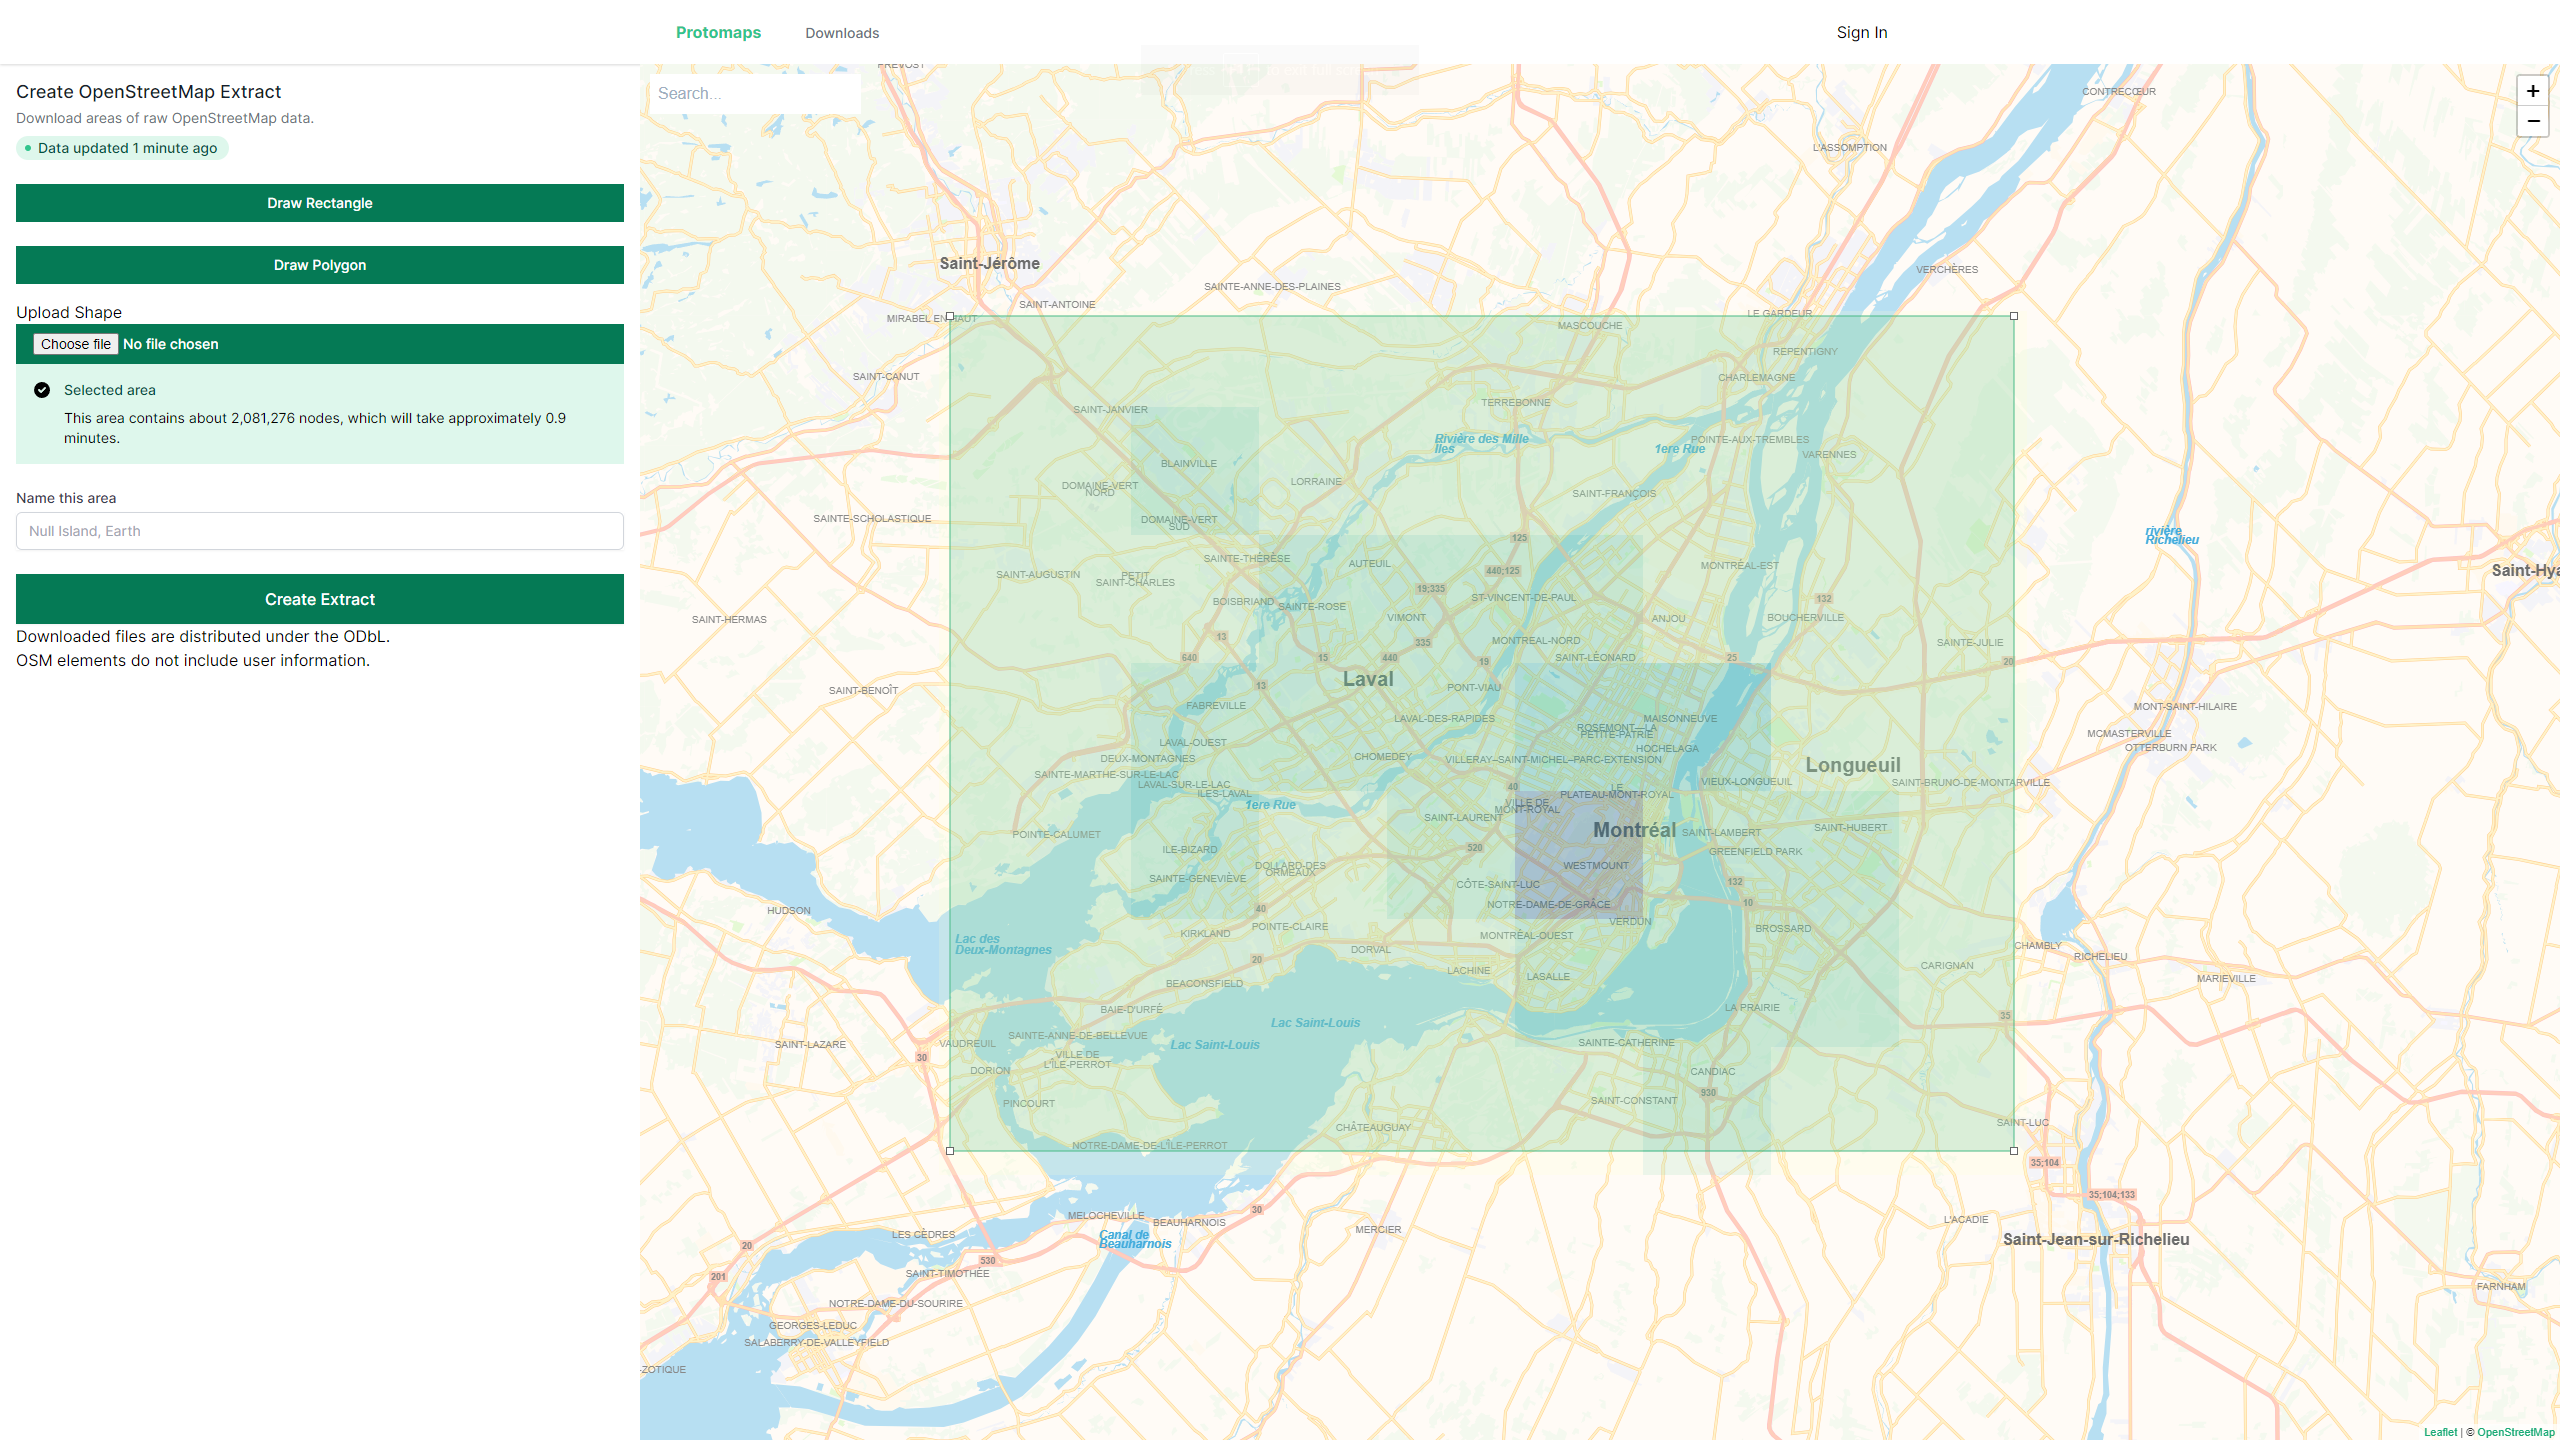
This prompts an important question for accessibility analysis- how large do you want your study area to be? Do you need a buffer area around your case study city? This depends on your own research interests and the kind of trips you are modelling. If your interest was local retail travel of less than 30 minutes then these trips would generally be quite contained within the metropolitan region of your city, and there would not be much requirement for a large buffer area beyond your case study. If on the other hand you were modelling commuting over rail networks, then commuters could travel long distances, and these trips would only be included if connected towns and cities were included in the study area.
For our Montreal example, we are going to be looking at local retail and hospital trips, and the case study area covers the metropolitan region as shown above. We have included the neighbouring settlements of Longueuil and Laval, as these are part of Montreal’s wider metropolitan region.
GTFS Schedule Data
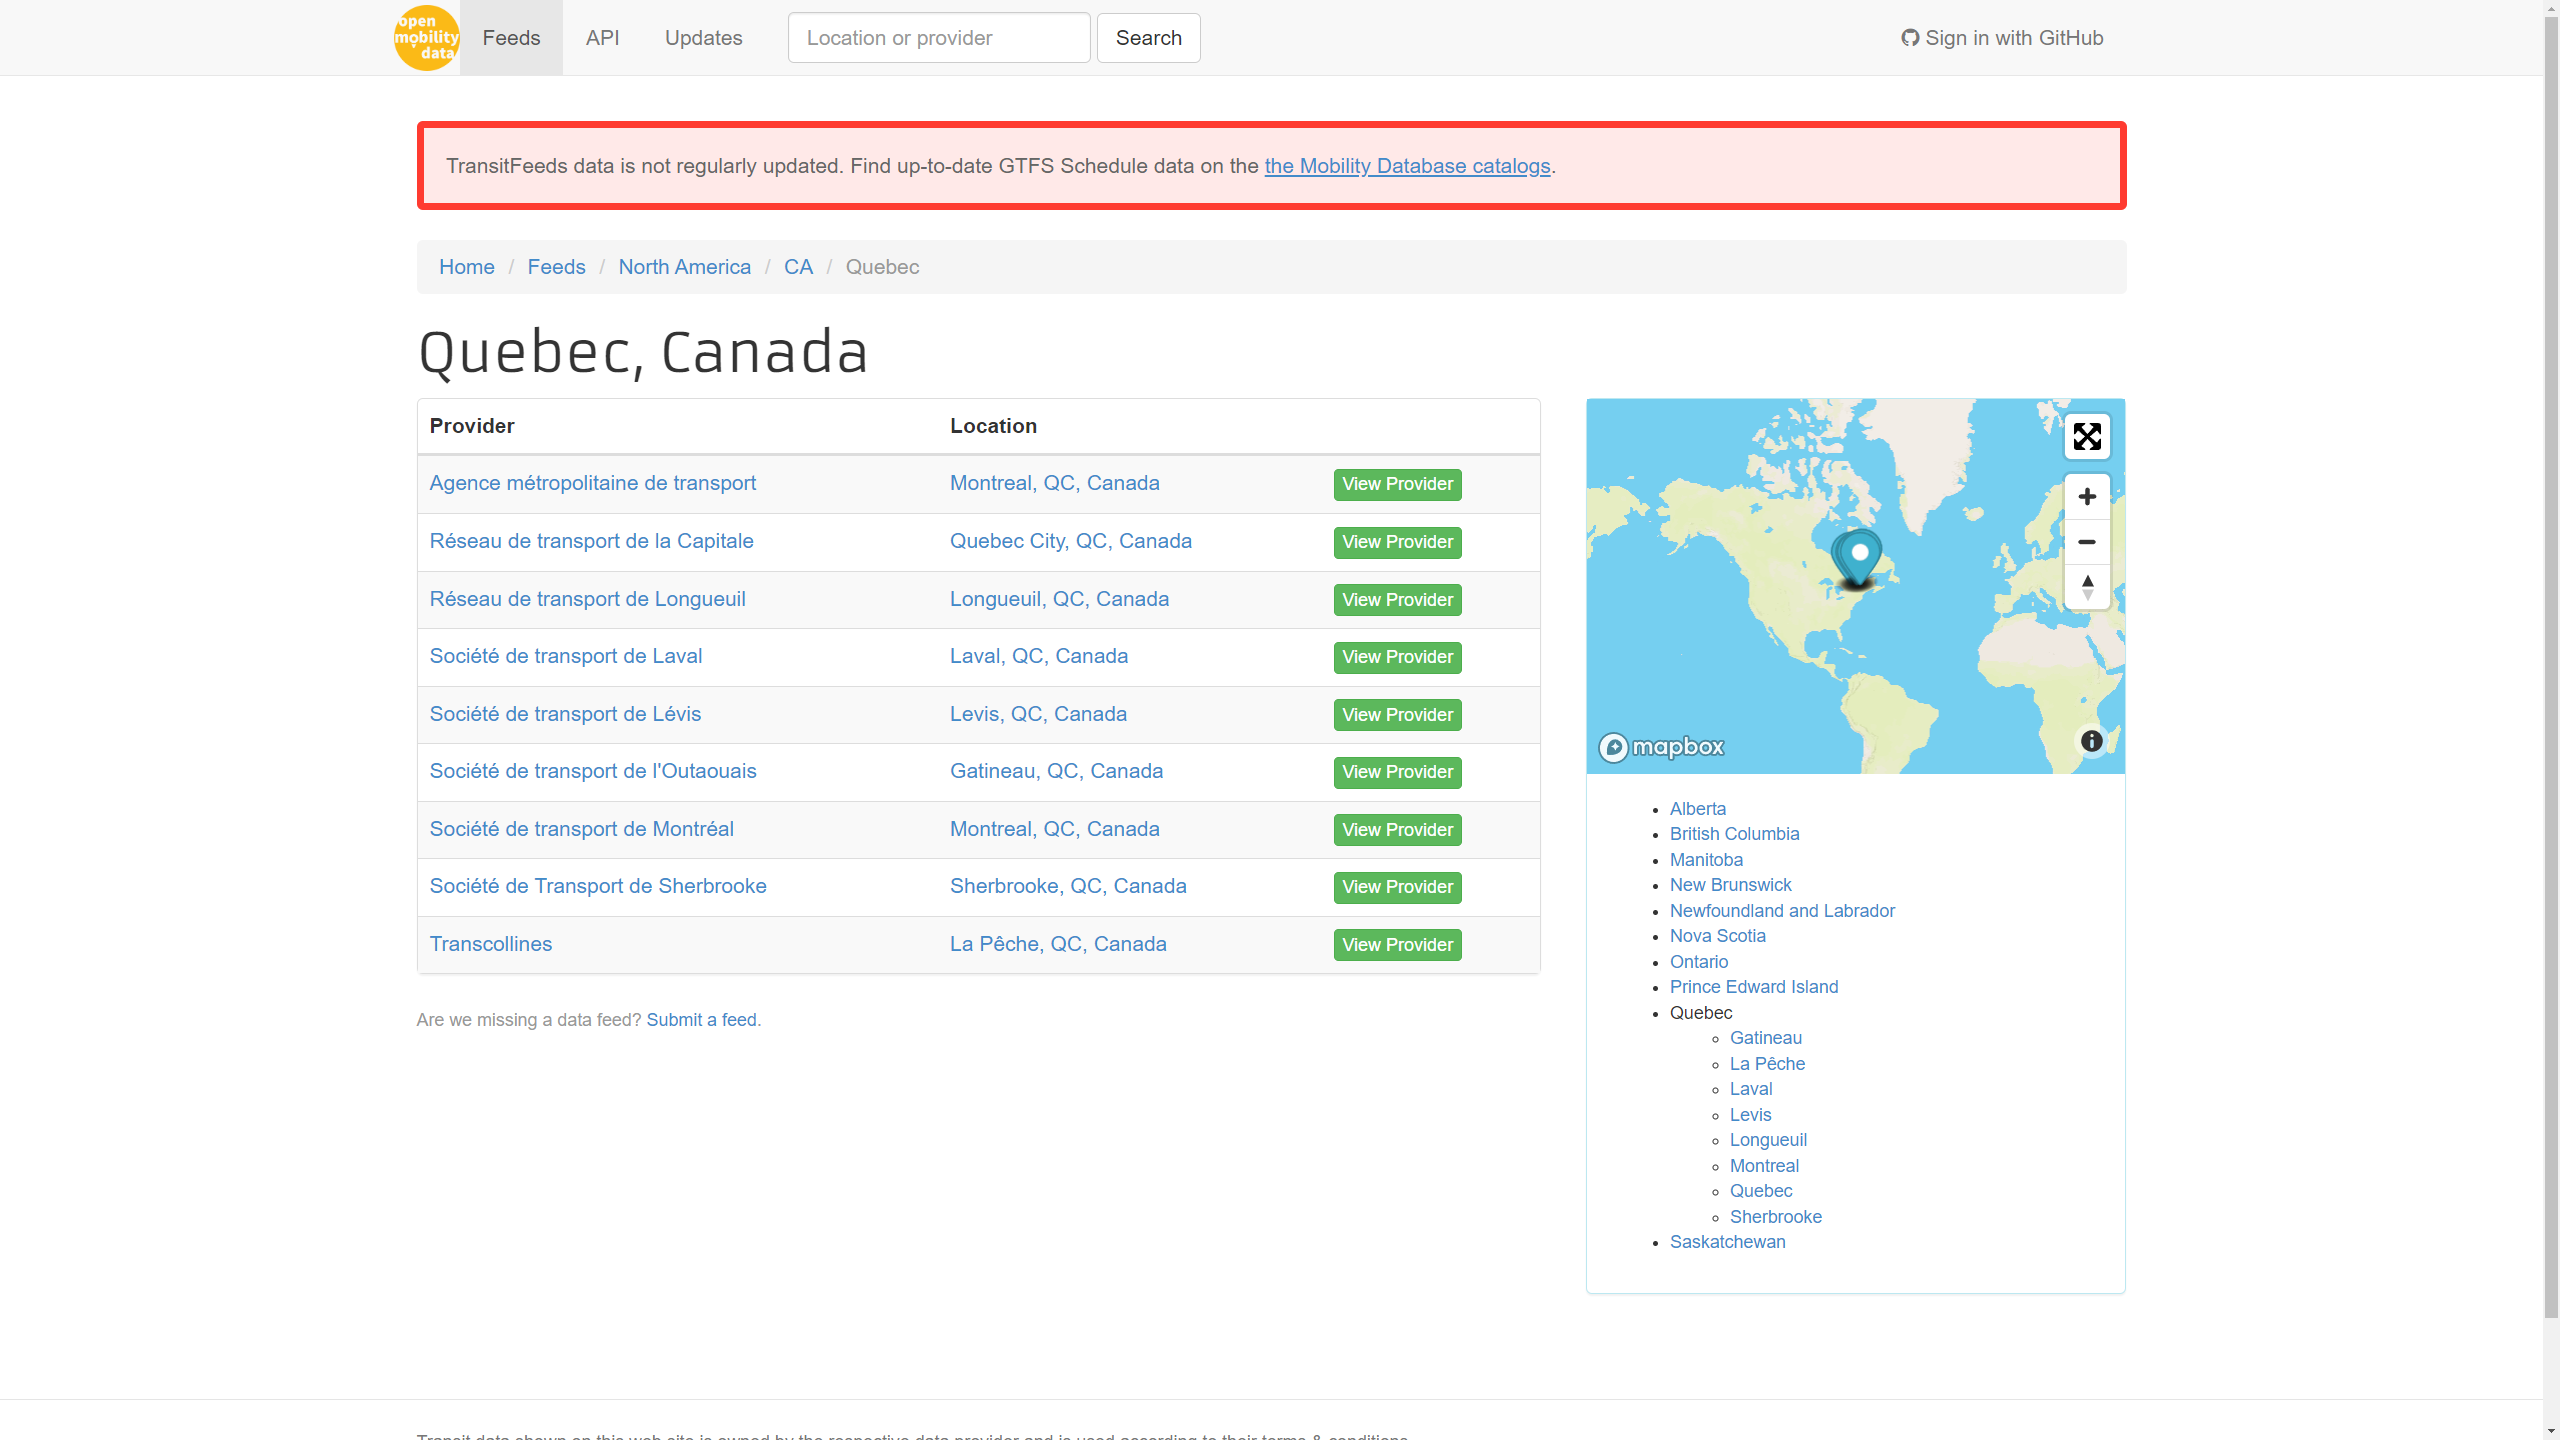
There are various websites that catalogue GTFS data sources-
You can also search on the websites of the city and transit authority of your case study. You may need several GTFS files to cover public transport services in your study area. For example, the Montreal files include a GTFS file for Montreal city authority, as well as GTFS for the neighbouring authorities of Laval and Longueuil.
We also need to consider whether to include national rail services as well. These are typically run by a national transport operator and their GTFS data will come from a different source (e.g. National Rail for UK, Via Rail Canada). If you are only interested in travel within a city then long distance rail services may not be required, but regional commuting studies often would need to include national rail. In our Montreal example we are going to stick to local public transport- metro and bus services.
A final important issue to consider for GTFS files is the time period they cover. Schedules change month to month and generally transit authorities publish schedules that describe services for the next few months or up to a year ahead of the publication date. When we are running the accessibility model, we need to specify a departure date and time, and this time needs to be covered by our GTFS file(s). The GTFS files in the Montreal were published in April 2023, so we can query dates in April, May and June 2023.
Population Grid and Point of Interest Data
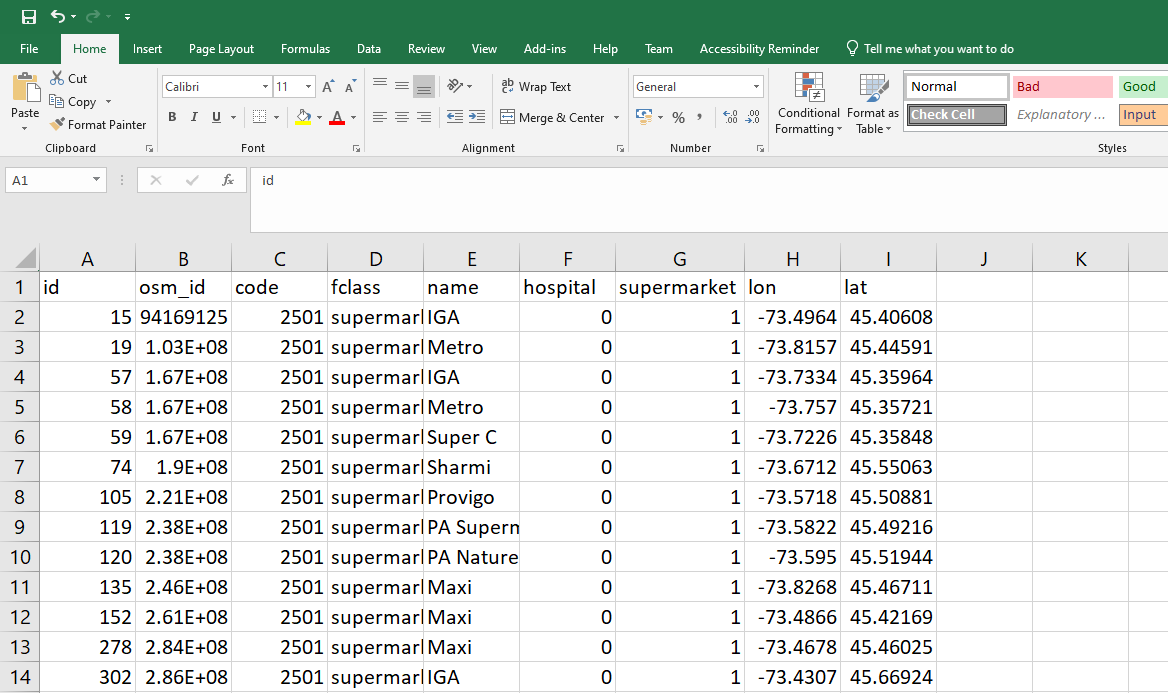
For Point of Interest data we are going to use OpenStreetMap again, this time accessed through Geofabrik for Quebec and then clipped to the study area. You can choose any time of amenity you are interested in. In the example we look at supermarkets and hospitals. Note that r5r needs the location files with the columns id, lon, lat, {opportunity name} where lon and lat are the WGS84 coordinates and the opportunity column is a numerical representation of the trip destination opportunity. As seen below, we are simply representing the opportunity as 1 (present) or a 0 (not present)-
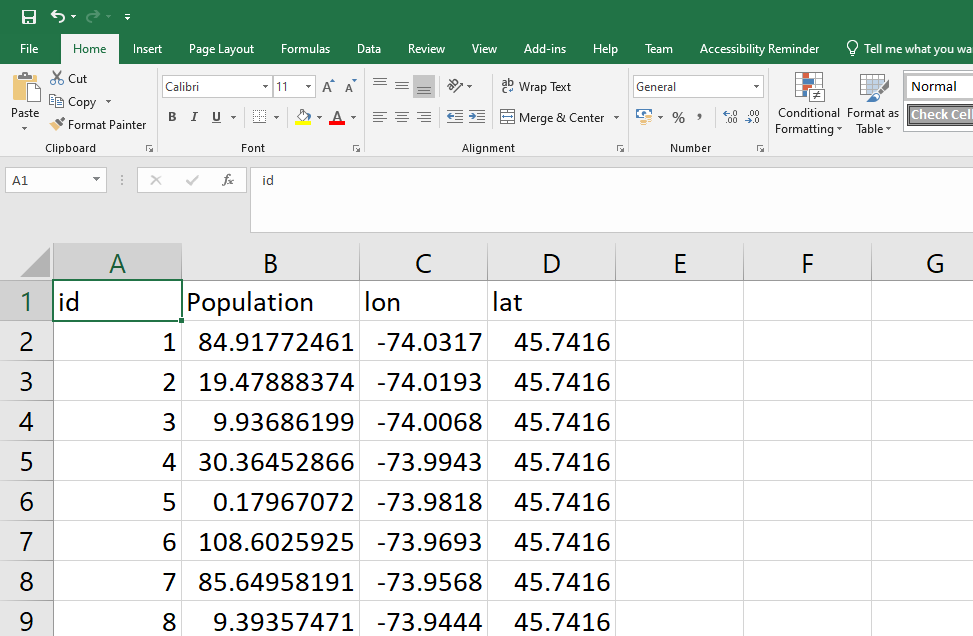
For our population data, we could use census blocks or a grid. Grids are advantageous in terms of the aesthetics of the maps produced. We can source population grid data of the globe at 1km and 100m resolution from the Global Human Settlement Layer. Note that the resolution is important here. A 1km grid will run accessibility queries very quickly, but will be quite sparse aesthetically (we use a 1km grid here as an example). A 100m grid will produce excellent maps but will dramatically slow down performance. A good compromise will be 250m or 500m grids. Another good approach would have been to use the H3 hex mapping library, as this works globally and produces good quality maps.
The population grid data is in the same format as the POI data, this time with the opportunity (population) expressed as the number of people-
Now that our data is ready we can move on to running some accessibility analysis.
Workshop Pages–
- R5R Accessibility Workshop Intro
- Getting Started & Installation
- Transit Schedule & Street Network Data
- Accessibility Example 1 – Access to Facilities: Retail & Hospitals
- Accessibility Example 2 – Travel Time Matrix and Isochrones
- UK Transit Data – TransXchange & ATOC
- London in R5 and Modelling Large Cities
- Accessibility Analysis Further Resources
