Visualisation Projects by CASA Urban Spatial Science Students

Each year CASA master’s students demonstrate their spatial data visualisation skills with a group project. The theme this year was ‘Urban Futures’, and students have produced some very impressive and diverse work, experimenting with a range of visualisation tools and techniques. Click on the images below to visit the project websites.

Urban Resilience Projects
Two groups explored at urban resilience and climate change. Some excellent interactive mapping work was created analysing Urban Heat Island effects in the Greater Bay Area of China (one of the world’s largest and fastest growing city regions) and at the potential impacts of sea level rise in New York City.

Urban Heat Island in Greater Bay Area, by Heyang Zeng & Yuqing Han. https://mazzylion.github.io/

Sea Level Rise & the Future of NYC, by Wenhao Xu, Jie Zhou, & Yunlong Li. https://gordenleee.github.io/Casa0003_Group_Work/

Transport Sustainability Projects
Transport sustainability was another popular topic in urban futures. This included investigating 15 Minute City Accessibility in London (mapping the recent UBDC data), exploring the sustainability of the freight and logistics industry in the USA, and mapping the growth and sustainability of Los Angeles.

Is London a 15 Minute City? By Xinyu Wu, Shijie Wang & Chenxi Yan. https://sheenwu-student.github.io/Viz-15min/visual_website/html/base.html

Sustainable Freight & Logistics. By Xi Jin, Tonghui Zhou, & Yihan Xu. https://xijincecilia.github.io/Urban-Future-US-Freight.github.io/

Urban Expansion & Sustainability in Los Angeles. By Zihan Xu, Yining Cui, & Yunqi Sun. https://xuzihan-010.github.io/Casa003.github.io/

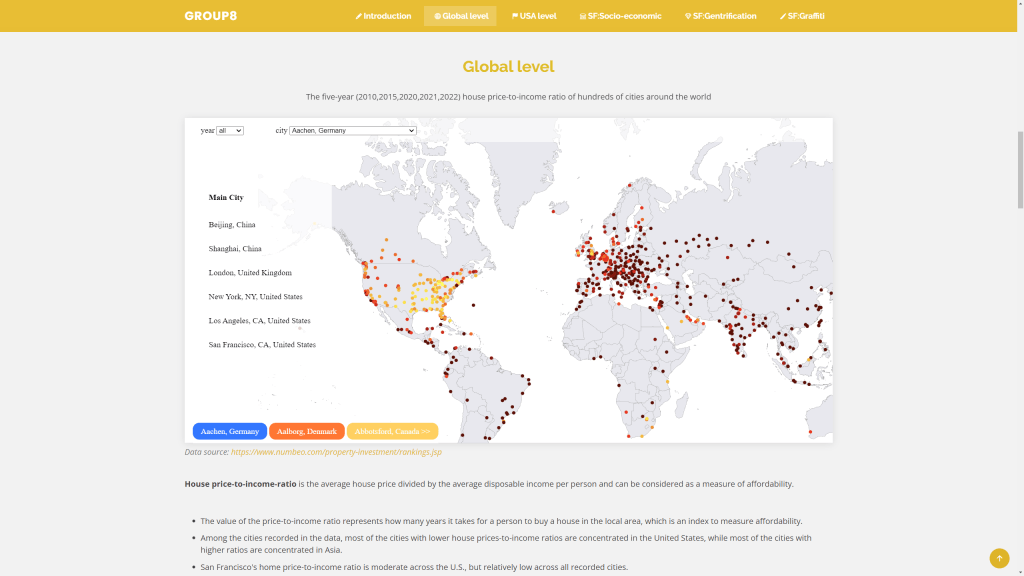
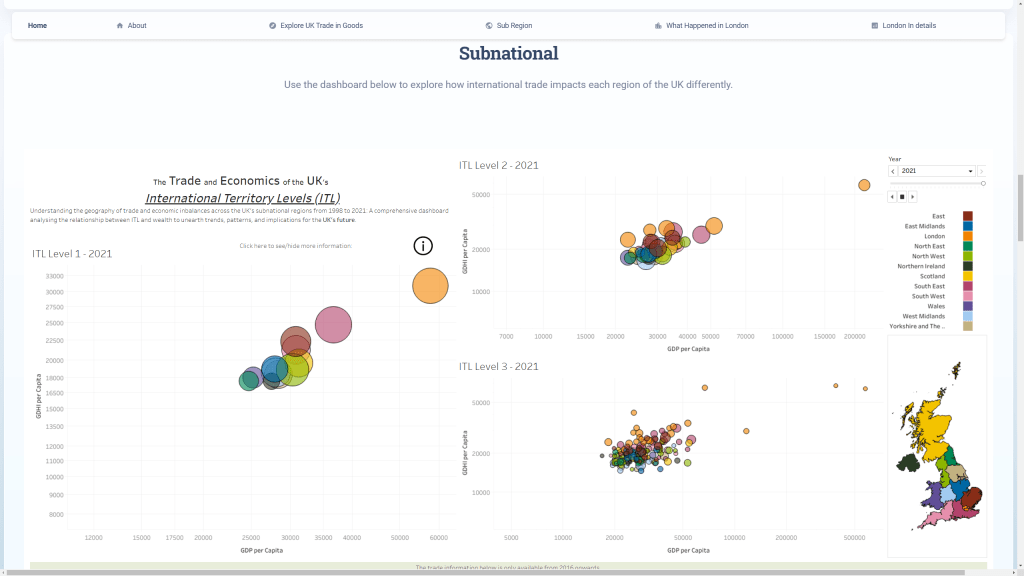
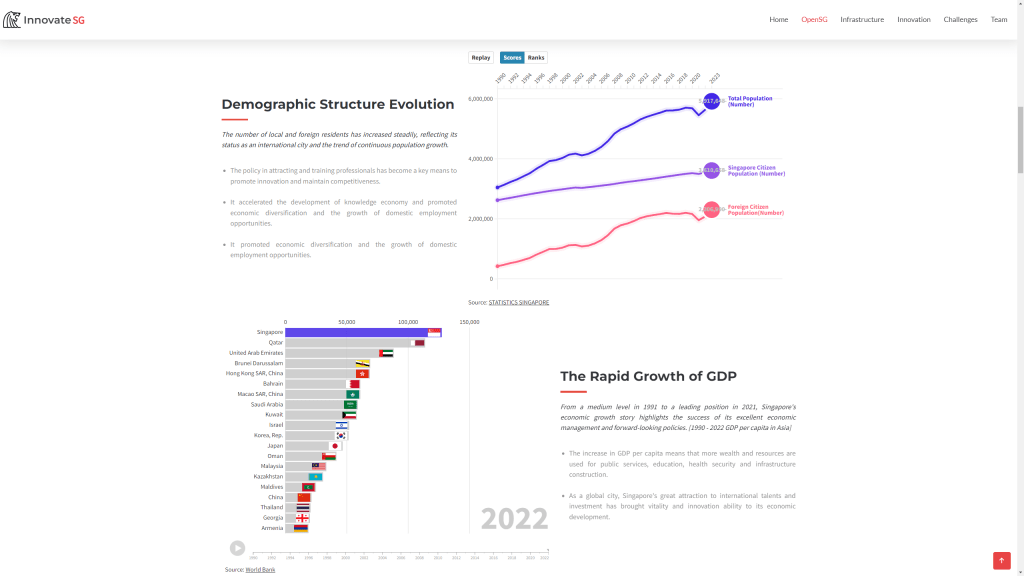
Economic Change and Innovation Projects
Several groups explored different aspects of economic futures. This included analysing the UK’s international trade and sub-regional performance using interactive dashboards; and charting innovation policy in Singapore and its international competitiveness with animated charts and mapping.

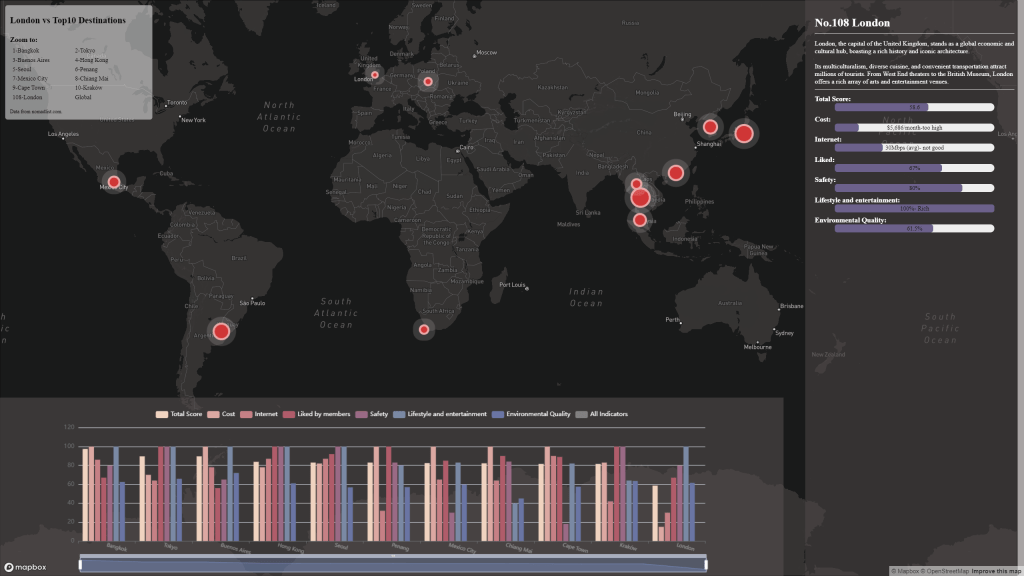
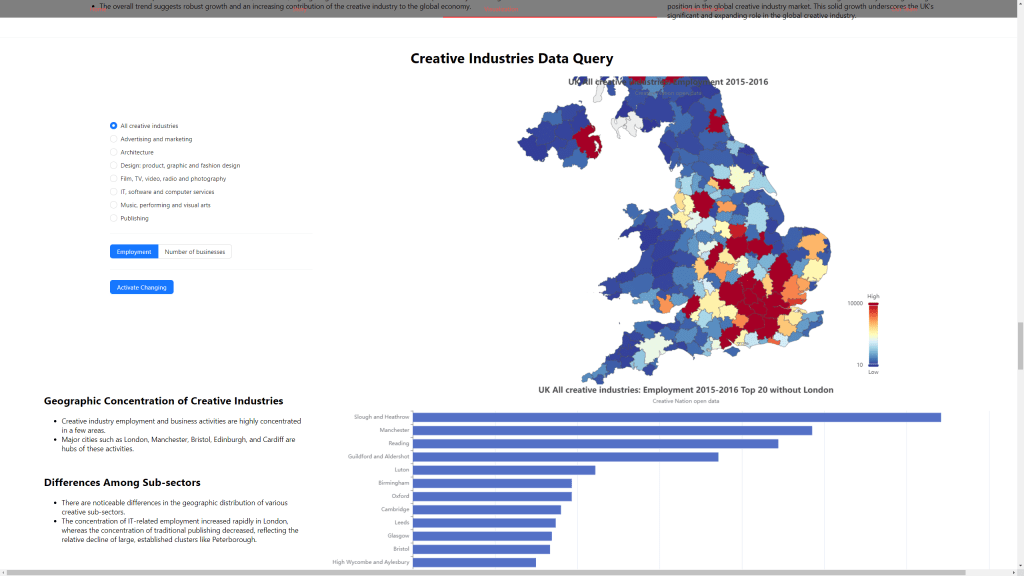
The phenomenon of mobile knowledge economy workers or Digital Nomads was explored in terms of analysing London compared to other global cities. Finally the importance of the Creative Industries to the UK economy was visualised using interactive maps and charts.

UK’s Economic Horizons. By Juan Esteban Lamilla, Yuhao Chen, & Zihan Liu. https://lem-c.github.io/vue-mapkit/

Singapore Innovation & Competitiveness. By Xinyan Gao, Jinting Ji, & Yongliao Wei. https://yongliaowei.github.io/web-demo/

London’s Embrace of Digital Nomads, by Wenda Xu, Ruxuan Huang, & Yilin Yang. https://yiliny7279.github.io/Digital-Viz-Group/

UK Creative Industries by Zhenghao Weng, Yicong Li, & Ruici Xia. https://zhenghao-weng.github.io/data-viz-group/#part-2

Social Change and Ageing Societies Projects
Another increasingly important aspect of urban futures is planning for ageing societies. Two groups explored this topic, the first looking more particularly at ageing societies and facilities globally and with the case study of Bournemouth, and the second group exploring ageing societies both globally and in Manchester.

Ageing Communities and our Urban Future by Victoria Chen, Keyi Luo, & Yixiao Zhao. https://keyi0787.github.io./

aa

Global Ageing and Age-Friendly Cities, by Jialong Dong, Mingyuan Zhao, & Hanzhi Yang. https://fry222.github.io/

Global Data Visualisations by CASA MSc students

Each year MSc students at CASA demonstrate their spatial data visualisation skills with a group project. The theme this year was ‘Global to Local’, and the class of 2022 has produced some particularly excellent work, experimenting with a range of visualisation tools and techniques.

Sustainability and Climate Change
Several groups interpreted the main theme in terms of global sustainability and climate change. These projects included investigating flood events, both locally and in terms of impacts on the UK; global heating in the Arctic and sea-level rise; and the effects of global temperature changes on the wine industry, with both positive and negative changes. Some interesting visualisation trends here included the use of high quality spatially detailed global datasets; using non-Mercator web projections (a recently added feature to Mapbox); experiments with animated data; and also use of 3D globes.

Global Flooding Events Map by Group 1 (Nina Fabsikova, Sangbin Lee, Murray Chapman, Xinyi Huang, Henry Song)
Global Temperature Change and the Wine Industry by Group 5 (Andras Gelanyi, Ruby Johnson, Haofu Wang, Shuyi Zheng, Kameliya Staneva)
Arctic Sea Ice and Climate Change by Group 3 (Nayomi Kasthuri Arachchi, Haisu Chen, Daphne Badounas, Tianyi Li)

Global Cultural Interactions
Taking a very different tack, several groups looked at Global to Local interactions in terms of cultural and culinary exchanges. One group used story-mapping techniques to show Chinese cultural diffusion, including the history of the Silk Road and Zheng He’s early voyages of discovery. Another approach was to look at global interactions through food, including creating a virtual kitchen as an interface to global food journeys, and mapping major food importers to the UK.

The Silk Road and Chinese global cultural diffusion by Group 4 (Rongrong Xue, Yuning Jiang, Zhonghao Li, Ce Hou)
The World to your Kitchen, global food study by Group 7 (Zicheng Fan, Jingran Ma, Hangjin Cai, Haotian Meng, Liyuan Dong)
Global food imports to the UK by Group 10 (Shengwei Deng, Zhenlei Gu, Jing Liu, Yujie Hu, Xinwei Kang)

Energy and the Cost of Living
Returning to the sustainability theme, several groups zoomed in on energy and affordability challenges that the world is currently experiencing. One group used some advanced D3 charting to tell the story of the UK’s varying energy imports and wider global affordability challenges (see image below). A different take was to chart the energy generation mix in major economies around the world. Another topical affordability challenge relates to housing in major cities, and one group mapped relative affordability of housing in major cities across the globe.

UK energy import dependency over time by Group 6 (Sunny Zhao, Elika Sinha, Val Ismaili, Ankur Shanker, Bolin You)

Global energy consumption by type by Group 2 (Jiani Gong, Jeonghwa Kang, Linhan Cao, Seren Shi)
House price affordability comparison in global cities by Group 8 (Mengjiao Luo, Jieqi Tan, Wei Wang, Siyi Cai, Yanpu Huang)

Covid-19 Visualisations
The aftermath of the pandemic is still with us, and tracking Covid-19 was another interpretation of the Global to Local theme. One group experimented with animation to track the spread of the virus. Another used graphs and interactive mapping to investigate how effective lockdown policies were in a series of case studies.

Global Spread of Covid-19 by Group 9 (Ian Liu, Peizhao Wang, Shirao Zhang,  Miaomiao Pan, Lin Sheng)
Global Covid-19 infections by Group 11 (Jikai Song, Lucia Zhang, Jianqiang Li)

Global Digital Divides
Finally, another interesting take was to think about online communities as interactions between global and local, including the changing geography of internet access and the division of the world into different online platforms by language and political and economic divides.

Global internet connections and the digital divide by Group 12 (Ruijie Chang, Maidi Xu, Zhiheng Jiang)

Here is the full list of project groups and websites-

  1. Delugeo Global Flooding-
    Sangbin Lee, Murray Chapman, Xinyi Huang, Nina Fabsikova, Henry Song
    https://nfabsikova.github.io/delugeo/
  2. Clean Energy Now-
    Jiani Gong, Jeonghwa Kang, Linhan Cao, Seren Shi
    https://linhanccc.github.io/CASA0003-GROUP2/website.html
  3. 30 Degrees Rising-
    Nayomi Kasthuri Arachchi, Haisu Chen, Daphne Badounas, Tianyi Li
    https://eloquent-crepe-6cc40a.netlify.app/
  4. Chinese Cultural Diffusion-
    Rongrong Xue, Yuning Jiang, Zhonghao Li, Ce Hou
    https://casa-chinese-cultural-diffusion.github.io/digital-viz-Chinese-Cultural-Diffusion/html/main.html
  5. A Change in Climate, a Change in Taste-
    Ruby Johnson, Haofu Wang, Andras Gelanyi, Shuyi Zheng, Kameliya Staneva
    https://agelanyi.github.io/climate-and-uk-wine/website-frontend/index.html#firstSection
  6. Why are energy prices rising?-
    Sunny Zhao, Elika Sinha, Val Ismaili, Ankur Shanker, Bolin You
  7. The World in your Kitchen-
    Zicheng Fan, Jingran Ma, Hangjin Cai, Haotian Meng, Liyuan Dong
    https://world2kitchen.github.io/The_World_in_your_Kitchen/P0_Panoramic_and_Fullpage/fullpage.html
  8. San Francisco: Global to Local-
    Mengjiao Luo, Jieqi Tan, Wei Wang, Siyi Cai, Yanpu Huang
    https://casa0003group8.github.io/HousepriceSF/index/housepriceSF
  9. How does Covid-19 influence the world?-
    Ian Liu, Peizhao Wang, Shirao Zhang,  Miaomiao Pan, Lin Sheng
    https://peizhaowang.wixsite.com/casag9covidimpact
  10. From the Global to your Table-
    Shengwei Deng, Zhenlei Gu, Jing Liu, Yujie Hu, Xinwei Kang
    https://zhenleigu.github.io/CASA0003_Group10/
  11. Did Lockdown really Stop the Virus?-
    Jikai Song, Lucia Zhang, Jianqiang Li
    https://jikaisong1997.github.io/
  12. Worldwide Digital Divides-
    Ruijie Chang, Maidi Xu, Zhiheng Jiang