As the costs of recent droughts spiral from USA to Australia, West Africa to India, we’re getting a taste of what a significantly warmer climate would be like. Critically as the scientific evidence mounts up that climate change is occurring, global carbon dioxide emissions are soaring. Why is this?
I’ve designed a new website Carbon Chart visualising current data to answer this question.
There’s no single ideal metric to determine the contribution of different countries towards global warming, and a range of different perspectives need to be considered, as well as related issues of economic development and poverty reduction. The design of Carbon Chart is intended to allow the comparison of several perspectives.
So where are the maps? I’ve gone for a graph approach to focus on change over time. See Kiln’s excellent Carbon Map website for a cartogram-based approach to understanding global warming.
Current emissions data do not make happy reading. CO2 output is increasing in the developed world in consumption terms, and is rocketing in the developing world, especially China. We’re replicating our carbon intensive economic model on an incredible scale.
Maybe the climate models are wrong, or maybe an international climate agreement with substance is just around the corner. But right now it’s difficult to see how the more extreme scenarios of 4°C+ warming are going to be avoided.
Despite the litany of sins levelled at the automobile- it’s woeful energy efficiency, harmful pollution, congestion, road casualties, damage to public space, contribution to obesity- we are still wedded to the car. In the UK the car accounts for over three quarters of trip miles. The flexibility, security and door-to-door convenience of automobile travel remains a winning combination, particularly when we spent most of the 20th century developing car-based cities with limited alternatives.
Current planning practice restricts car travel to improve sustainability and urban quality of life. Short of an outright ban however, the car is here to stay in some form or other.
For the automobile to be in any way sustainable we need to radically challenge current systems of car design, driving and ownership to effectively create a new mode of transport. This post considers whether such a revolution is possible in light of exciting recent innovations.
Electrification
We now for the first time have competitive alternatives to the internal combustion engine car on the market with electric and hybrid models from the world’s biggest manufacturers. These technologies dramatically reduce or remove tail-pipe emissions. Surely then the eco-car has now arrived and city transport has been saved?
Nissan Leaf plugport
Well… as electric cars (and vans/taxis/buses) become more widespread urban air quality should improve dramatically, as should vehicle mileages. But as we generate the majority of electricity using fossil fuels (and will continue to do so for the next 20 years+), CO2 emissions from electric cars remain significant.
Furthermore several other car design issues are not solved by electrification, such as energy used in manufacture, road congestion, safety and damage to public space. There’s a danger that electric cars become merely a green-wash cover for business as usual, rather than as a step towards bigger change.
Sharing
Most cars are driven for a relatively short period each day, and are parked the rest of the time occupying land (around 10% in cities). On-street parking eats up large amounts of valuable public space from pedestrians, public transport and cyclists. It’s a wasteful situation, both for the efficiency of cities and for the environment due to the vast amounts of materials and energy used to manufacture our largely idle cars.
One increasingly popular solution in cities is car-sharing, with the largest company Zipcar now up to 700,000 members. Car-sharing is a convenient and affordable option for many city residents who want regular car access without the hassles of ownership. The popularity of smartphones provides an easy way to manage car-share booking. Comparable sharing trends are also evident for ride-sharing and for urban cycling.
Is sharing the answer then to the sustainable city travel? It’s definitely an important trend. Sharing allows a much better pricing model for driving, paying by the mile and charging more at peak times, thus encouraging more efficient behaviour.
Car-sharing coverage is limited however to denser urban areas, and it is not yet clear to what extent car-sharing can significantly reduce the total number of vehicles and car parking space in cities.
Self-Drive The last trend is at a much earlier stage than electrification and car-sharing, yet it could have the most far-reaching consequences. Sat-nav and parking-assist technologies were early steps towards greater automation in cars. Now Google as well as several manufactures have working prototypes of autonomous or self-driving vehicles.
Amazing yes, but what’s the point? In its current form, the application of this technology is not immediately clear, beyond providing a luxury car gizmo that lets you read the paper while your car drives you to work. But future developments will likely involve cars built around self-drive from the ground-up.
Potentially you could have a city taxi fleet of fully autonomous electric cars, requested by smartphone, operating 24 hours a day, moving to areas of high demand, charging batteries when not in use. Whilst bad news for taxi-drivers, such a system could be highly efficient and provide a quick and flexible complement to mass transit networks.
A related concept has already been developed in a rail-pod form operating at Heathrow airport. Dubbed Personal Rapid Transit, it is intended to combine the advantages of both private and public transport. Obviously the challenges of converting such a system to operate autonomously in the ‘wild’ of the urban environment are many, yet are increasingly being tackled.
If such a system could safely and legally operate, the implications would be massive. Imagine freight and courier services operating automatically at night to minimise disruption; your car picking up your shopping on its own, or taking a nap and waking up at your destination.
Reality Check It’s easy to get carried away with the wonders of new technology. Transport challenges require political and economic solutions as much as technological brilliance. Indeed relying on car manufacturers alone to green transport is as unlikely as “Beyond Petroleum” BP and Shell delivering the renewable energy revolution. Yet there is some incredible innovation currently emerging, and the next couple of decades are certain to be very interesting times for urban transport.
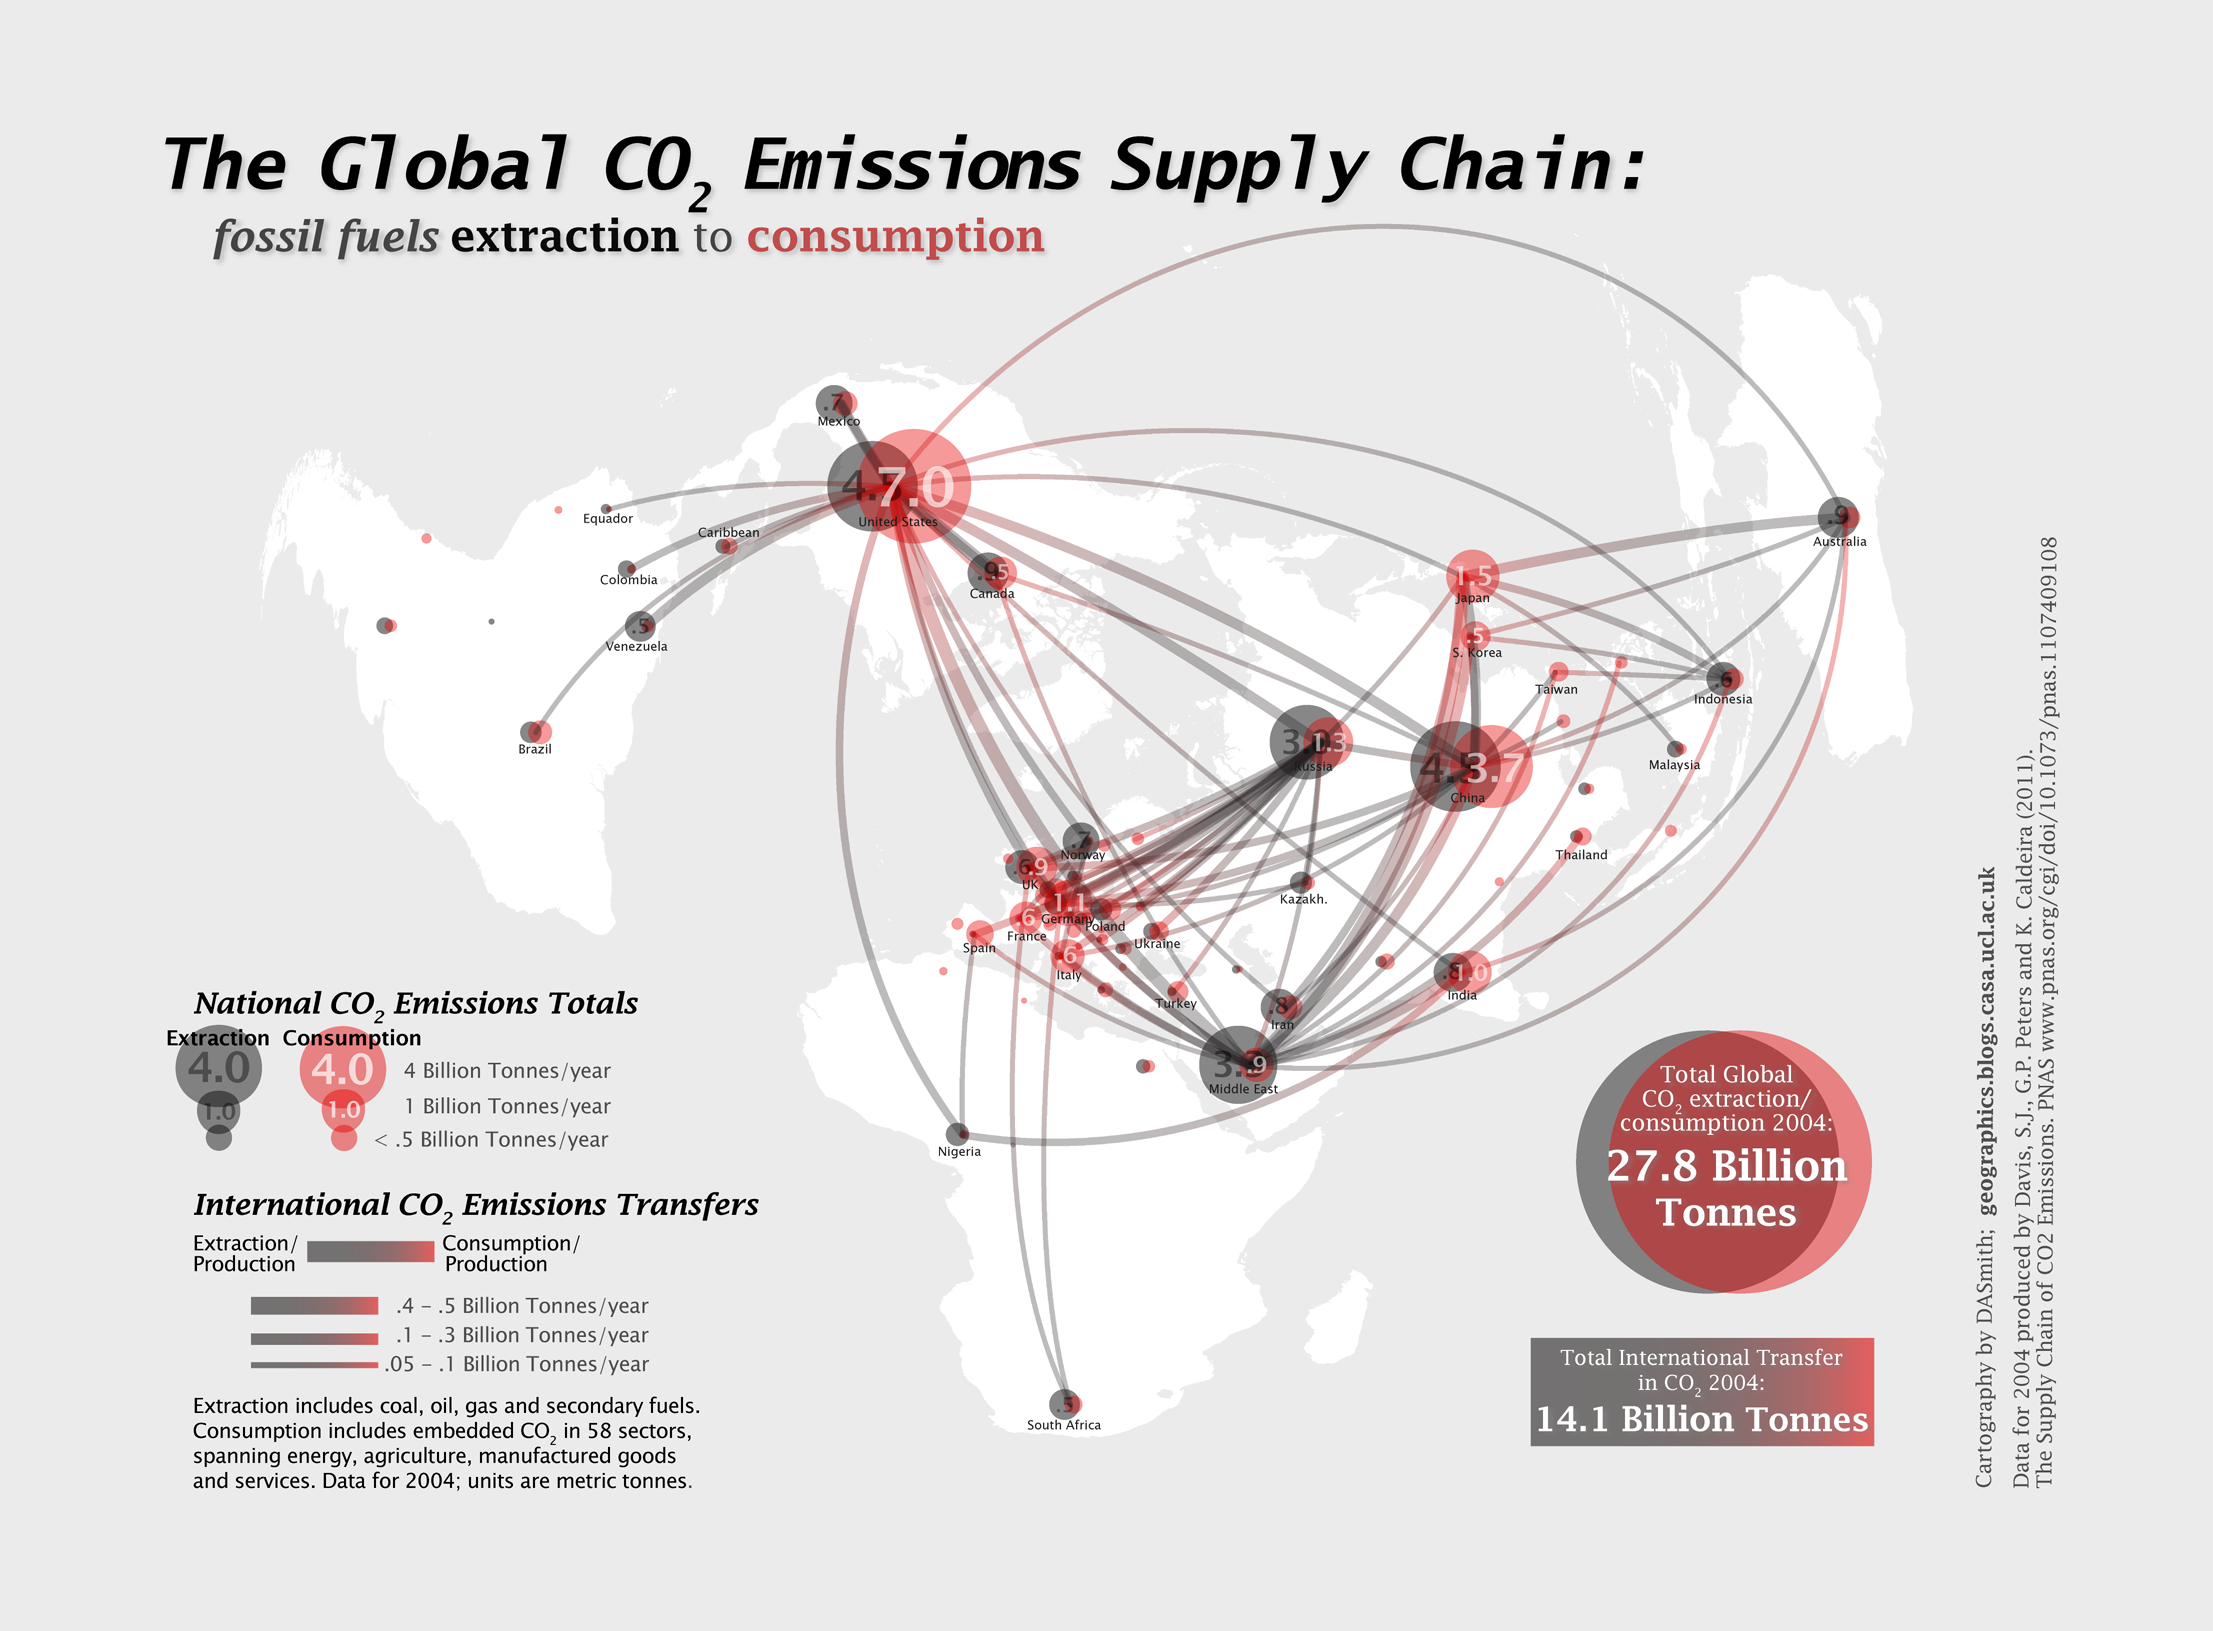
Every so often you come across a dataset that really amazes you in its richness and ability to change perspectives on understanding the world. One such dataset has been produced by academics at Stanford and Oslo tracing the global supply chain of CO2 emissions.
Traditionally emissions are attributed to countries depending on where fuels are burned- the point of production. This approach puts big industrial polluters like China at the top of the emissions pile. Yet globalisation means that we are linked into an increasingly complex web of trade that challenges a production-based understanding of emissions. A quarter of fossil fuel CO2 emissions can be considered as being embedded in manufactured goods that are consumed away from the point of production.
To address this issue Davis, Peters & Caldeira have created a database charting the global supply chain of CO2 emissions from extraction to production and finally to consumption. The database covers coal, oil, gas and secondary fuels traded by 58 industrial sectors in 112 countries for the year 2004. Even better, the entire database is available online.
Maps of the major carbon transfers included in the paper highlight firstly the massive flows from the energy rich Middle East and Russia, and secondly how production emissions from industrial countries such as China are ultimately driven by consumption in the affluent core of USA, Europe and Japan.
Being a mapping type, I feel that the flow maps in the paper miss out much of the amazing detail in the dataset, such as extraction to consumption flows within countries (half of all emissions). So I decided to put my visualisation skills to the test…
First up I produced a proportional bubble map of extraction and production, giving a good sense of the relative scale between countries. Economies with high levels of both extraction and consumption (e.g. USA and China) exploit their own energy resources and have large emission flows within their national boundaries. Other large consuming nations that lack energy resources (e.g. the EU, Japan and South Korea) must import them.
Next I mapped the transfers of CO2 embedded in trade flows, using the same black-red colour scheme to indicate flow direction. While the visualisation is not as straightforward as the simpler flow map above, it gives a strong sense of the amazing complexity in global trade relationships and highlights clear patterns and structures.
Black lines emanate from the major energy exporters of the Middle East and Russia. Indeed the degree to which all of Europe is dependent on Russian energy is highly alarming. Major industrial countries act as intermediaries, both importing and exporting emissions. For instance China and Japan import energy and materials from the Middle East, Indonesia and Australia, then export manufactured products to the USA and Europe. The USA is top predator in the emissions food chain, spectacularly drawing in goods and resources from every corner of the globe and racking up over 25% of global emissions by consumption.
The data is for 2004, so some current trends like the strong growth of South America, continued growth of China and the strengthening relationships between China and Africa are not fully captured. Hopefully an update will come in the not too distant future.
On the cartography side, I went for the Azimuthal Equidistant projection to emphasise the close North America-Europe-Asia links. This projection is recognisable as the basis of the United Nations logo. Here however it is global capitalism and environmental exploitation drawing the world together like some kind of tightening noose. After another empty environmental conference at Rio+20, burning billions of tonnes of fossil fuels is set to remain a defining characteristic of our age.
There have been some wonderful flow maps appearing online recently, such as Paul Butler’s global facebook friend’s map, and maps of global trade and flight patterns. Inspired by these, I’ve been mapping travel patterns in Great Britain using a similar “night-lights” visual style.
The above maps use data from the UK census connecting where people live to where they work, showing how transport flows form complex urban networks and extensive metropolitan regions. The data is at ward level, allowing a good level of detail:
Taking this visualisation further, a key issue for policy makers is how people travel, with private cars having greater energy, pollution and congestion impacts than alternatives. The final map below groups work trips into car, public transport and walking-cycling travel using an RGB colour scheme, creating a galactic effect (click for larger):
The aim of the visualisation is to put travel patterns in the context of the diverse urban scale and geography of Great Britain, and reveal the degree of regional variation.
The map really highlights how different London is in terms of its extensive regional public transport network, with the other major English conurbations like the West Midlands, Manchester and West Yorkshire being highly car dominant in comparison. The variation in public transport levels could be argued to relate to London’s massive size, yet the Scottish cities of Glasgow and Edinburgh perform well in public transport terms, despite being smaller than England’s northern cities.
Active travel modes of walking and cycling are generally minimal. The cities that do relatively well are the “cathedral cities” like Cambridge and York, with a few surprises like Hull.
The maps were created in ArcGIS using the XY to Line tool, then exported to Illustrator. A key aspect of such flow visualisations is that the thousands of overlapping flows add together to form denser links using a cumulative transparency effect. This is much easier to achieve using a vector graphics program such as Illustrator. Would be nice in a future post to add Northern Ireland and the Republic, and will get a data update with the 2011 census next year.
As cities expand with multiple centres spread over massive regional hinterlands, the need to better understand the geographical variation across and within cities has become more pressing. This need applies strongly to issues of travel sustainability, where urban centres differ greatly in the accessibility they facilitate for private, public and active transport.
Spatial indicators are a useful tool to summarise complicated intrametropolitan patterns, as illustrated in my new working paper mapping CO2 emissions from journey-to-work travel across the London Region. The results of this indicator show a massive range of travel emissions by workplace of up to 300%, with particular problems for airports and the specialised employment region of the Western Sector, as can be seen in the map above.
This paper was co-authored with Joan Serras at CASA, who helped with the development of the road and public transport network analysis to model realistic routing behaviour from origin and destination flows from the 2001 census. One interesting aspect to this was the inclusion of GPS data to model average road speeds in London as illustrated below:
Full paper abstract:
“This paper develops a methodology for estimating network distances and CO2 emissions for UK census ward-level journey-to-work interactions. Improvements are made on existing empirical measures by providing comprehensive intra-metropolitan analysis; increasing network routing accuracy with UK public transport timetable and GPS-based average road speed data; allowing multimodal travel; and developing metrics suitable for travel sustainability analysis. The output unit of CO2 emissions has been selected to enable the integration of mode-choice and travel distance data, and to aid compatibility with integrated assessment applications.
The methodology is applied to the case study of the London Region for the year 2001. A very high degree of intra-metropolitan variation is identified in the results. Employment sub-centres diverge in their per-capita CO2 emissions by up to 300%, with specific problems of carbon intensive commuting to major airports and the specialised employment region of the Western Sector. These findings indicate that subcentre travel variation may be intrinsic to polycentric urban structures. The paper discusses means to improve the methodology, in relation to issues of coefficient disaggregation and modelling more complicated multi-modal trips.”
With a few notable exceptions such as Cambridge, cycling in UK cities is minimal compared to continental European examples, and boosting cycling is a massive opportunity for improving travel sustainability and health in Britain. The potential is greatest in London, with its high density mixed-use form, relatively flat topography and benign climate that favour cycling; in addition to congested and expensive car and public transport networks that leave many looking for alternatives.
Planning policy at the Greater London Authority level recognises this potential and has become increasingly pro-cycling, with recent investments in the ‘Cycling Superhighways’ scheme– longer distance radial cycle routes that (almost) join up; the bike hire scheme; and modest improvements at many junctions and in cycle parking facilities. These measures have helped to increase the level of cycling in London substantially in the last decade (although beginning from a very low starting point):
So can this trend be accelerated to make London a real cycling metropolis, a larger scale version of Copenhagen or Amsterdam? I believe it’s possible, but I discuss one of the biggest obstacles here- safety and space. (Other obstacles include terrible integration with public transport, bike theft, image…).
On the 4th October a student from Korea was crushed to death by an HGV vehicle near Kings Cross, becoming the 13th fatality in London this year. Overall cycling fatalities and injuries declined in the early 2000’s, in line with pedestrian and car accidents in general, but have increased in recent years as cycling trips have increased. There were 467 serious injuries in 2010, up 8% on the previous year. Cycling in London is a hectic experience of dodging traffic and aggressive driving, with very minimal segregated lanes and many dangerous junctions to avoid.
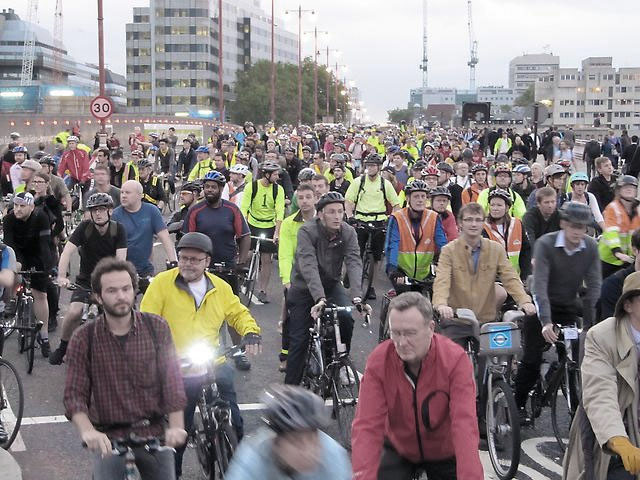
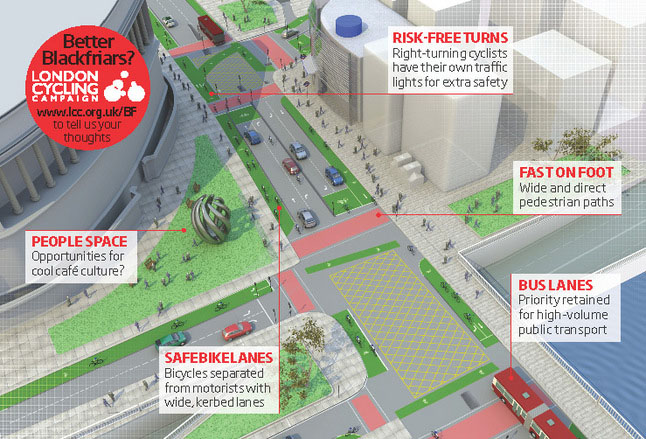
Currently a high profile debate is occurring over one such accident blackspot, Blackfriars Bridge, where two cycling fatalities have occurred in recent years. The London Cycling Campaign argues that the TfL junction redesign fails to address cycle safety, and staged a mass demonstration on the 12th October of 2,500 cyclists, and are promoting an alternative junction design. Additional campaigns include the issue of HGV’s, which are responsible for half of all cycle fatalities.
Ultimately a serious increase in cycling use requires a serious improvement in safety, and this means the creation of many more segregated cycling routes and the redesign of many key junctions. These measures will translate into reductions in vehicle flow in London, and TfL seem largely unwilling to make this compromise when it comes to major roads. A significant culture change accepting cycling as a key part of London’s transport would have to occur to achieve a genuine cycling city.
The UK government is seeking to dramatically overhaul the English planning system, releasing the National Planning Policy Framework consultation in late July. This intends to streamline the system, reducing the array of previous planning policy frameworks into a single 50-page document. Various government ministers, including the chancellor, have been arguing this is a vital reform to ‘get Britain building’ and boost growth in a time of economic hardship.
As someone who cares deeply about the economic success and quality of life of the UK, reading this document was very alarming, as its vague pro-development language fails to get to grips with the economic and built environment challenges we face now and in the future.
The document states there should be a “presumption in favour of sustainable development” yet fails to define sustainability in any rigorous way (i.e. natural resources, energy, carbon emissions…), thus effectively making policy “a presumption in favour of development”. The previous requirement to prioritise developing brownfield land, a central policy in urban regeneration, is abandoned. The section on transport is weak, stating applications “should not be refused permission on transport grounds unless the residual impacts of development are severe”. There is no understanding of cities as the engine of the UK’s economic growth, nor of the regional relationships that are needed for urban economic competitiveness.
Unsurprisingly there has been a backlash by many organisations against the proposal. As well as rousing the green lobby and the National Trust in opposition, the policy has the unusual achievement of bringing together both The Guardian and The Daily Telegraph in condemning it. On the transport side, the RAC and Campaign for Better Transport (again two organisations often in opposition) come together to criticise the current document. I would urge anyone concerned with these issues to take part in the consultation, or sign the National Trust Petition.
There is undoubtedly a need in the UK for major housing expansion and for facilitating business growth through planning. This requires a coordinated approach to development focussed on cities, urban regeneration, boosting the knowledge economy, and taking into account the severe energy constraints and carbon reduction limitations we face in coming decades (i.e. we need highly energy efficient homes and a decent life without mass car ownership). This document doesn’t even get close, and policy makers need to go back to the drawing board for a more progressive vision.


