World City Population Map Update with the New World Urbanization Prospects 2025

The interactive map of world city populations – https://luminocity3d.org/WorldCity/ – has been updated with the newest release of the UN World Urbanization Prospects (WUP), the leading dataset for understanding global urban dynamics. The new UN WUP 2025 release supersedes the 2018 version. It’s a major revision with updated demographic data a new harmonised methodology for calculating urban agglomeration populations based on urban land analysis (using the Global Human Settlement Layer data) compared to previous use of national administrative boundaries. The dataset also covers an updated time frame of 1975-2050. The dataset shows some dramatic changes in the ranking of the world’s largest urban agglomerations and predictions for urban growth in the next 25 years.

The online interactive World City map allows you to explore the overall trends in urban populations and the detailed dynamics of particular cities of interest. I have also created a non-interactive high-res publication version of the map below-

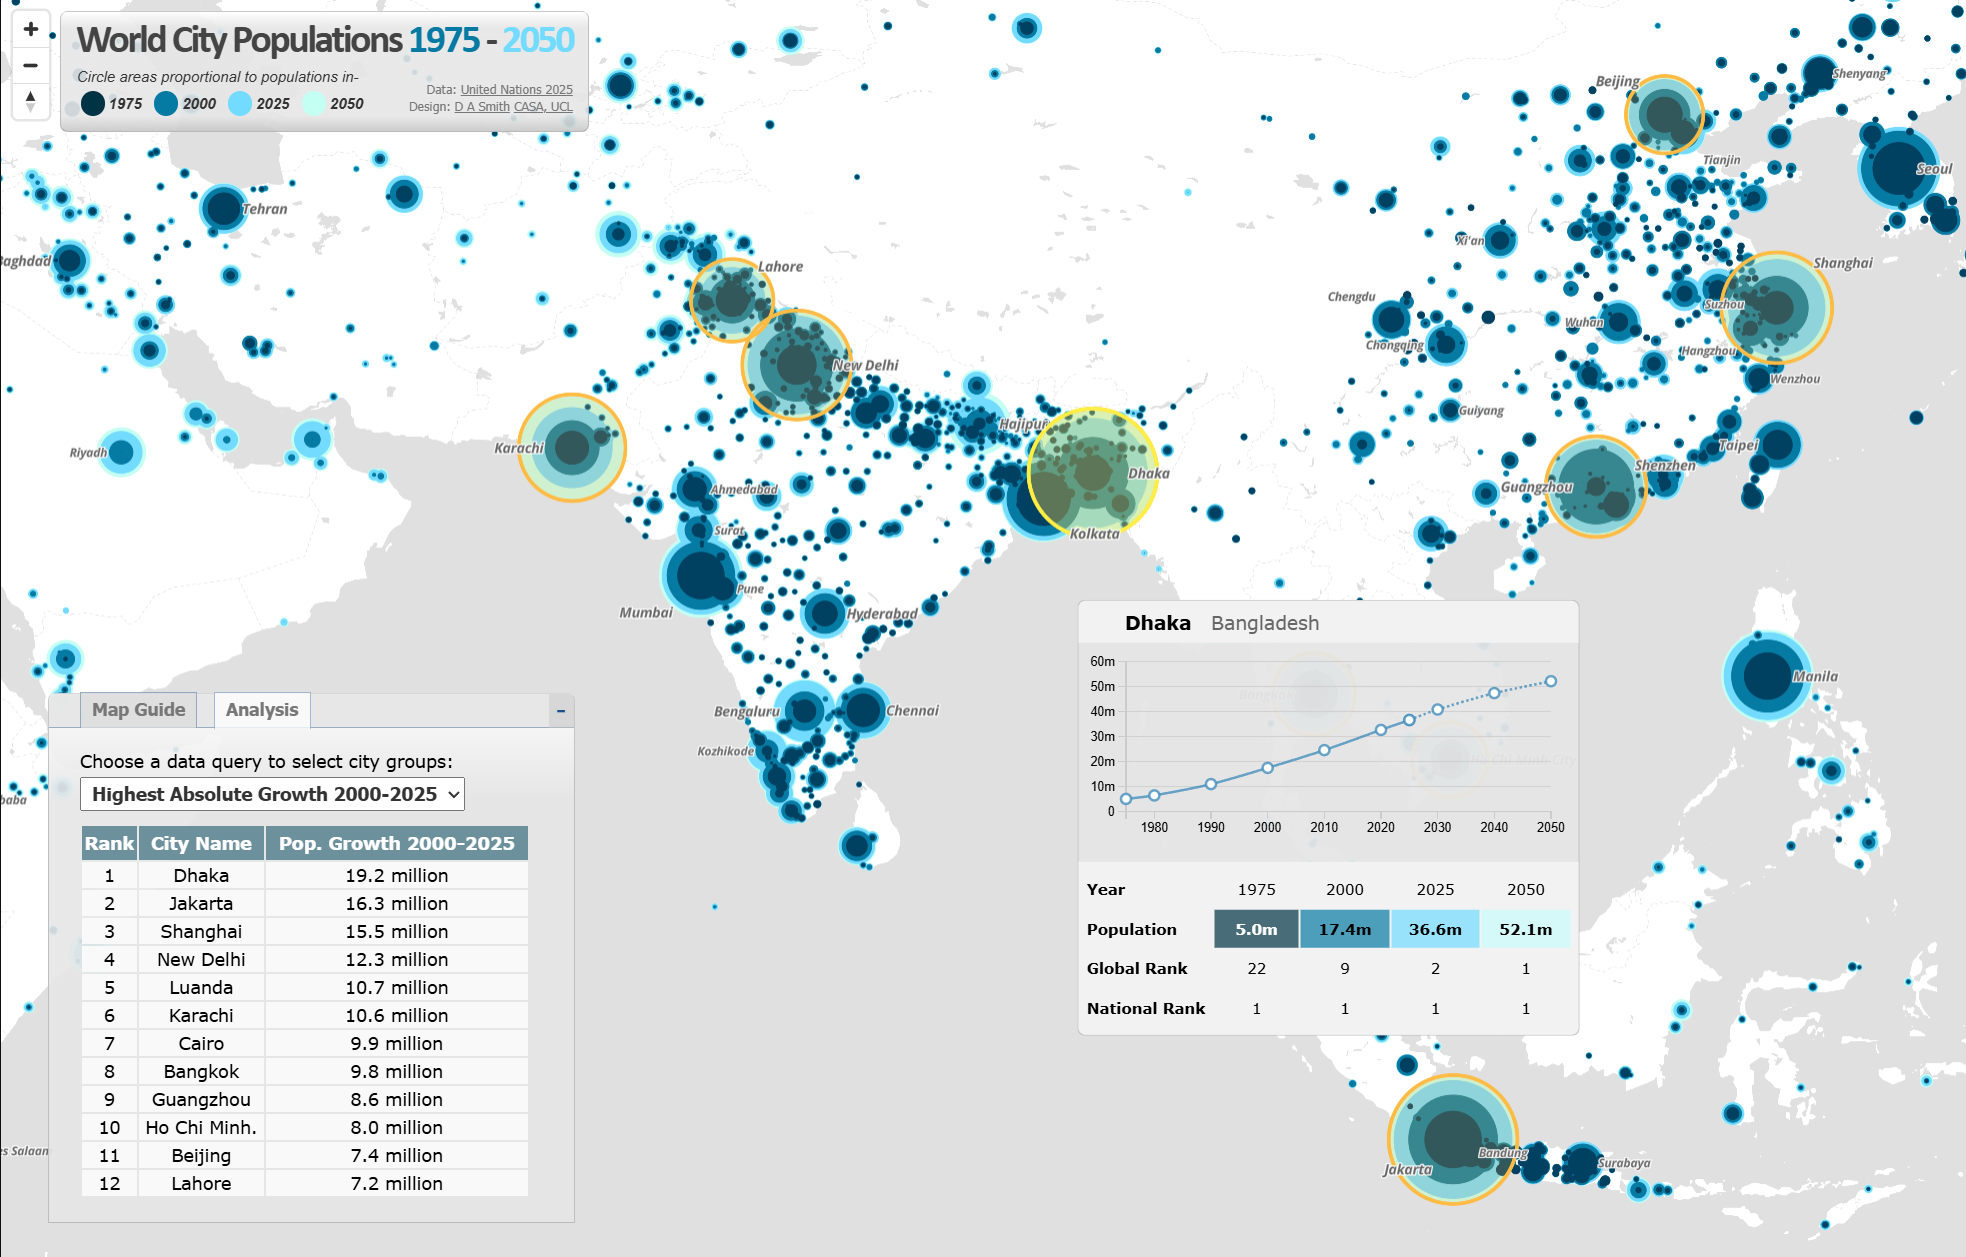
Jakarta and Dhaka Measured as the World’s Largest Urban Agglomerations
The UN WUP 2025 uses an updated harmonised global methodology for defining urban agglomerations as contiguous areas of high density urban land (above 1,500 persons per km2) with a minimum population of at least fifty thousand. This new methodology results in several changes to the ranking of the world’s largest city-regions. Tokyo, with a population of 33.4 million is 2025, is often measured as the world’s most populous city, but with this methodology Jakarta, current population a gigantic 41.9 million, replaced Tokyo in 2010. This change in Jakarta’s population appears to be due to updated demographic data, and a misalignment between Jakarta’s administrative boundary and its metropolitan region that caused previous underestimations (I got similar results for Jakarta with my own analysis of the Global Human Settlement Layer data). The projection is for Dhaka and Jakarta to become the first urban agglomerations to exceed 50 million people in 2050.

Urban AgglomerationPopulation 2025 (millions)Global Rank 2025Population 2050 (millions)Global Rank 2050
Jakarta41.9151.22
Dhaka36.6252.11
Tokyo33.4330.77
New Delhi30.2433.94
Shanghai29.6534.93
Guangzhou27.6629.28
Cairo25.6732.46
Manila24.7827.19
Kolkata22.5923.810
Seoul22.51021.212
Karachi21.41132.65
Mumbai20.21223.111

Data from UN World Urbanization Prospects 2025

Stabilisation of Urban Populations in China and India
Global urban growth in recent decades has been dominated by China and India. The next 25 years however project a more stable urban picture in the world’s most populous countries, with China starting to follow Japan and South Korea with an ageing and more static population. For example, Shanghai gained a massive 15.5 million people between 2000 and 2025, but this growth is predicted to slow to 5.5 million between 2025-2050. Some cities in West China such as Chongqing, Wuhan and Chengdu are predicted to lose population between 2025-2050, though there are larger population falls predicted in Japan and South Korea.

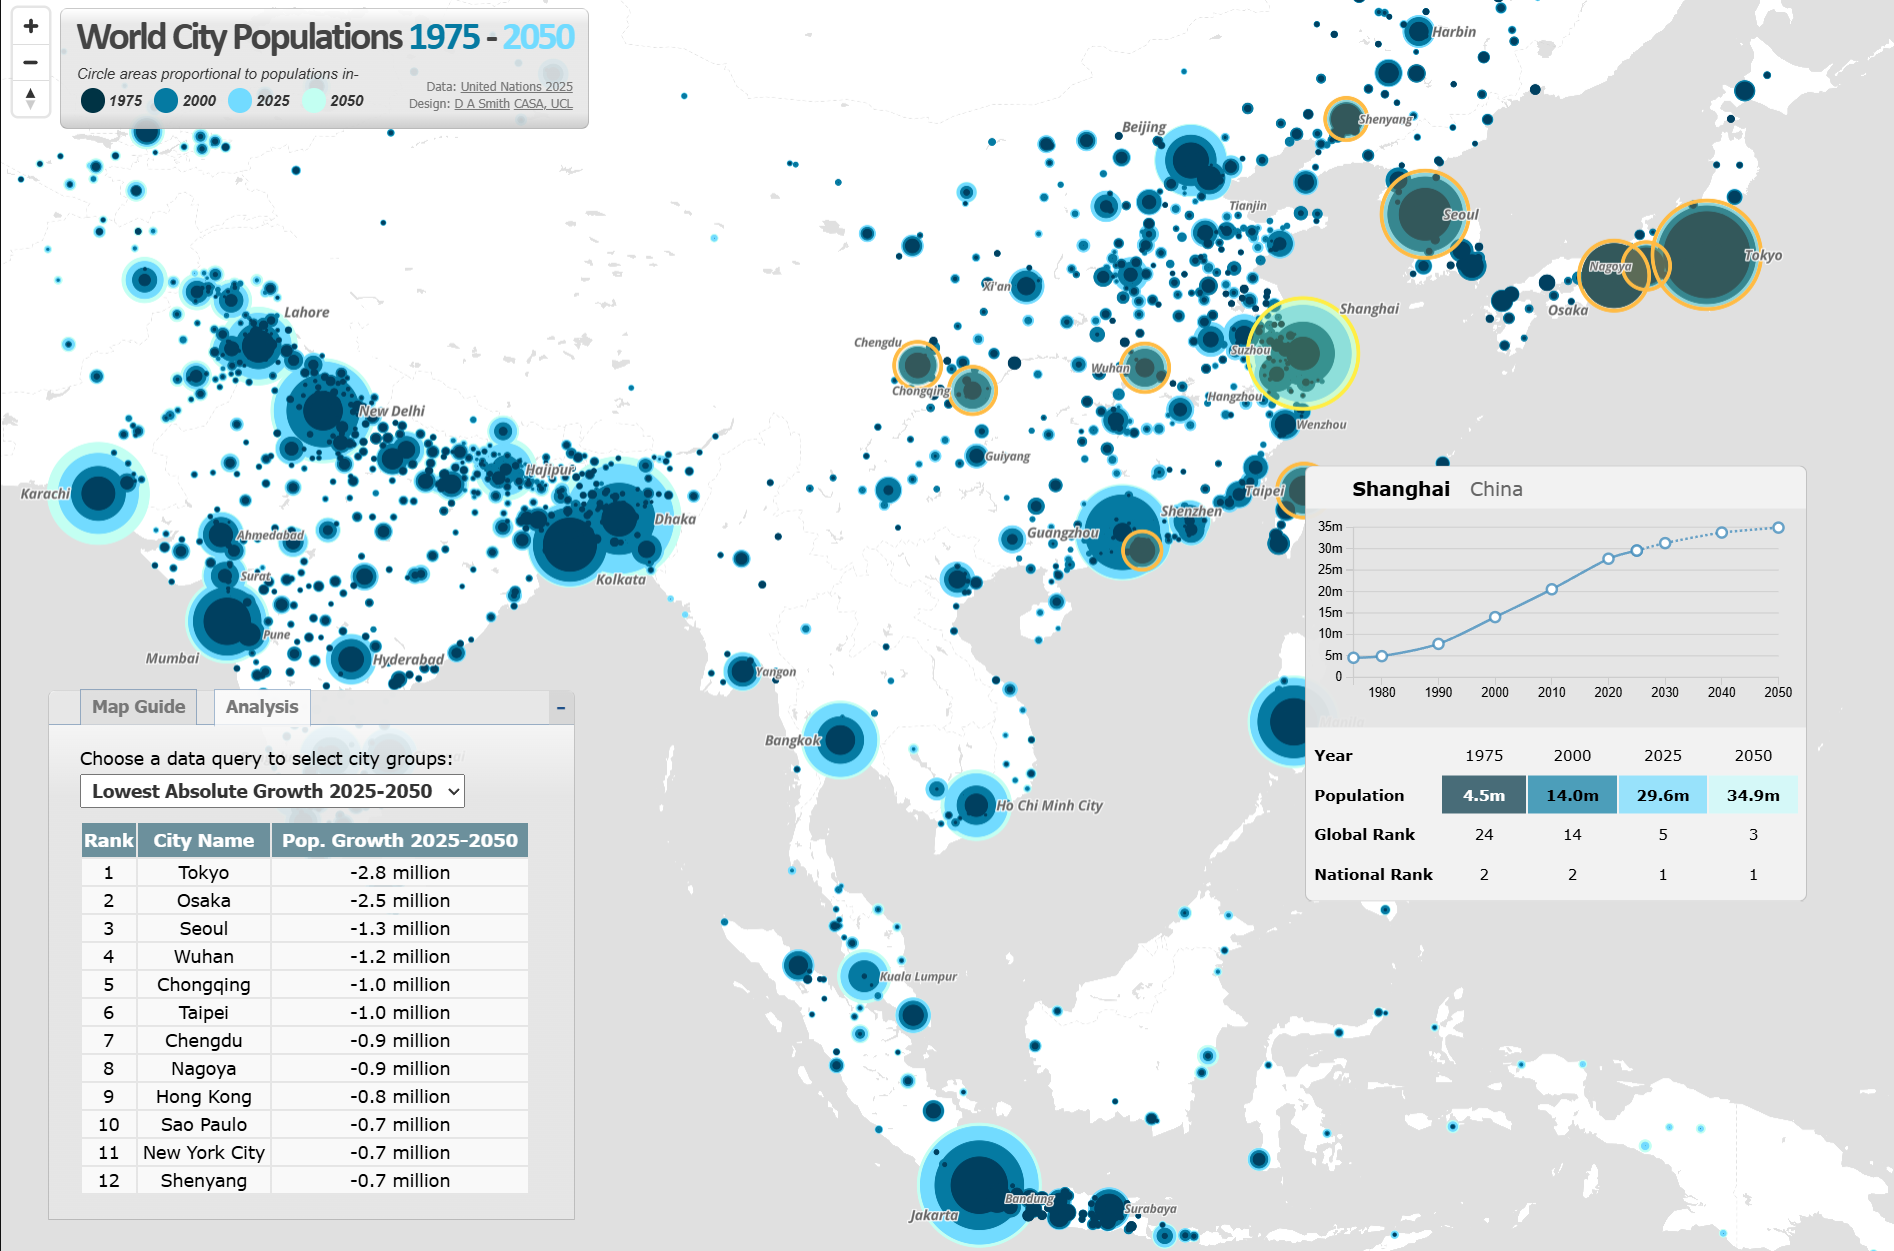
Population change in India’s largest urban agglomerations follows a broadly similar stabilisation pattern. New Delhi gained 12.3 million residents between 2000-2025 to reach 30.2 million people, but the population growth prediction for the next 25 years is lower at 3.7 million. A similar levelling off can also be seen in the Indian megacities of Mumbai and Kolkata. Urban growth is higher however in India’s South Asian neighbours. Dhaka in Bangladesh continues with very high rates of growth. Dhaka is currently the world’s second largest urban agglomeration at 36.6 million in 2025, and may become the world’s largest urban agglomeration in 2050. Pakistan shows a similar picture, with Karachi predicted to gain 11.5 million people between 2025-2050 to become the world’s fifth largest urban agglomeration.

Highest Growth Rates in Africa, Though Also Lower than Previous Predictions
Africa countries are generally much earlier in their urban transition and so have proportionally higher predicted rates of growth. Luanda is set to gain 8.9 million people between 2025-2050. Dar es Salaam and Addis Ababa are predicted to both become megacities of over 10 million in the next 25 years. Even In African cities however, this release of World Urbanization Prospects shows lower predicted growth for coming decades than previous predictions. Cities such as Lagos and Kinshasa have reduced populations with this methodology.

About the World City Population Visualisation
The interactive map has been built using Mapbox JS. The technique of overlaying proportional circles to show urban population change over time was first developed in a static map at LSE Cities Urban Age by Guido Robazza.

An Urban Renaissance Achieved? Mapping a Decade of Densification in UK Cities

It’s been 14 years since the landmark Urban Task Force report, which set the agenda for inner-city densification and brownfield regeneration in the UK. Furthermore we’ve seen significant economic and demographic change in the last decade that’s greatly impacted urban areas. We can now use the 2011 census data, mapped here on the LuminoCity GB site, to investigate how these policies and socio-economic trends have transformed British cities in terms of population density change.

The stand-out result is that there’s a striking similarity across a wide range of cities, with overall growth achieved through high levels of inner-city densification (shown in lighter blue to cyan colours) in combination with a mix of slowly growing and moderately declining suburbs (dark purple to magenta colours).

ChangeLegend


ManchesterPopDenChan01
BirminghamPopDenChan01
LeedsPopDenChan01
SheffieldPopDenChan01

We can see this pattern in the growing urban regions of Manchester, Birmingham, Leeds and Sheffield above. Manchester has the fastest population growth after London, with 8.1% growth in the city-region, and a massive 28% growth in the core local authority. Average densities in Manchester have gone up by 28% (+35 residents per hectare), but it’s not a uniform growth. There are new development sites at a very high 300 or 400 residents per hectare, contrasting with low density surrounds and the extensive remaining brownfield sites. There is a patchy nature to the current urban fabric of Manchester, indicating that much further development could still take place.

The West Midlands Conurbation is the third fastest growing city-region at 7.3%, with a higher 10% growth in the core city authority Birmingham. Density increases are more modest here (+13 residents per hectare) but the same general pattern remains. Similar patterns of high density inner-city growth are also clear in Leeds (5% growth) and Sheffield (8% growth).

The trend applies to medium size cities also. Those cities with the highest growth rates like Leicester (+18%), Nottingham (+14%), Cardiff (+13%) and Bristol (+12.5%) show fewer signs of suburban depopulation-

Nottingham Leicester
Cardiff Bristol

Scottish cities have a stronger tradition of high density inner-city living. With compact cores already in place, Edinburgh (+6.5%) and Aberdeen (+5%) have been expanding the inner city into Leith and Old Aberdeen-

Edinburgh Aberdeen

Meanwhile the UK’s former industrial powerhouses of Glasgow, Liverpool and Newcastle display a more problematic variation on this pattern. City centre intensification is still much in evidence, with core city authority populations growing at 8% in Newcastle, 6% in Liverpool and 4% in Glasgow. But this growth is in combination with outright decline in some surrounding towns and suburban areas, particularly around Glasgow. These patterns are linked to major programmes to overhaul poor inner-city housing stock, but are also inevitably linked to weaker economic growth in Glasgow and Liverpool. The picture is better in Tyne & Wear, where there are more positive employment signs (8% growth in workforce jobs 2001-2011).

Newcastle
LiverpoolGlasgow

What is driving this urban dynamic?

In addition to planning policy shifts, a series of economic and demographic changes are contributing to the pattern of central growth and struggling suburbs, as commentators have variously been observing in the UK and US (e.g. gentrification researchers, Erenhalt, Kochan). Demographic aspects include more students, immigrants, singles and childless couples. Economic aspects include city-centre friendly service and knowledge economy jobs, as well as increased costs of petrol. For these trends to occur over a wide range of demographically and economically diverse cities in the UK and beyond, clearly there are multiple factors pulling urban populations and growth in similar directions.

London Extremes


We’ve avoided the gigantic outlier of London so far. It’s a city apart in many ways- much larger (8.1 million in the GLA area) and faster growing (+14% 2001-2011). It’s also massively higher density, with average residents per hectare 50% higher (nearly 200 residents per hectare) than the next most dense city-region in GB. The biggest changes have been in Inner East London. Tower Hamlets (where Canary Wharf has boomed) is 1st on every indicator- highest population change (+28.8%), highest employment change (+50%!!), highest population density (324 residents / hectare). The pressures for growth in London are so high that there is little surburban decline in population terms (although employment has been declining significantly in Outer London).

London1

Yet the high rate of densification in London has come nowhere near meeting housing demand. London is the midst of a massive housing shortage and crisis, with some of the world’s highest property prices. The debate is currently raging about what needs to be done to accelerate construction, with advocates of transforming more land to community ownership (e.g. Planners Network UK), relaxing planning regulations such as the green belt (e.g. LSE SERC), and implementing an array of measures simultaneously (e.g. Shelter Report). We can see London’s challenges in the maps, such as the failure thus far of the flagship housing expansion programme, the Thames Gateway, to deliver. Some high profile development sites like Stratford and Kings Cross have only recently opened for residents and so do not show in the 2011 data.

London2
The Thames Gateway- aside from Woolwich, little housing has been delivered.

Another more surprising result is the fall in the population of Inner West London, particularly Kensington and Chelsea. While this finding does need some context- K&C is still the forth most densely populated local authority in the country- it’s still an amazing trend given the extreme population pressures in London. It is in line with arguments that the most expensive properties in London have become investments for international capital rather than homes for living. Such trends push prices up, cut supply and bring questionable benefits to the city. Addressing this issue would require tax changes, and macro economic factors like the value of the pound and yields on alternative investments are also clearly influential.

London3
Inner London- expansion in the East and decline in Kensington & Chelsea

Summary- an Ongoing Renaissance and Suburban Challenges

Well to state the obvious GB cities are, with only a few exceptions, growing significantly. That’s not to be sniffed at given the history of widespread urban decline throughout the second half of the 20th century. And secondly the pattern of growth in density terms is clear- densifying inner cities, and fairly static or declining suburbs. The scale of London and the severe housing crisis has it’s own unique dynamics, while Glasgow and Liverpool are still dealing with significant population loss in many areas of the city region. But on the whole, the pattern is surprisingly consistent across cities in Great Britain.

Clearly this review prompts a series of further questions analysing the economic, demographic, gentrification, deprivation and property market processes inherent in this urban change, and what future city centres and suburbs will be like. Hopefully this mapping exercise should is a useful context for the ongoing research.