Overview
London and the UK as a whole have been severely affected by the Covid-19 pandemic, creating multiple health, social and economic crises. Social distancing requirements have drastically reduced the safe capacity of public transport services. The London Mayor and Transport for London (TfL) have quickly responded with a radical plan for transforming Inner London into a walking and cycling city, with major streetspace reallocation and restrictions on car use. Where should this new active travel infrastructure be prioritised? Will it substantially change travel behaviour for the better? This article looks at plans for new cycling infrastructure in Inner London, and includes recent UCL research by Nicolas Palominos.
The Green Active Travel Response to the Covid-19 Pandemic
The concentration of people, activity and global connections in cities is normally their greatest asset, yet now is the source of acute risk and vulnerability during the coronavirus pandemic. Rail, metro and bus systems enable millions of daily trips to be made efficiently and sustainably, but their crowded nature is incompatible with social distancing. Recent estimates of how many passengers can safely use buses, trains and metro systems in London while enforcing a 2 metre social distancing rule are around 15% of full capacity. This restriction is devastating for transit cities to function, preventing people getting to work, school and basic services; as well as crippling the fares revenue for public transport providers. Although there are plausible scenarios where the 15% limit could be moderately relaxed (such as through mandatory mask-wearing and temperature screening, or an adjustment of the UK social distancing rules to 1.5m/1m) we are effectively looking at months (in the worst case years) with public transport operating at a severely reduced capacity.
With public transport now hampered for the short-to-medium term, there is a real danger that there will be a big increase in car use as lockdown restrictions are eased, undoing much of the recent progress towards sustainable cities and tackling urban problems of congestion, poor air quality, carbon emissions and obesity. The alternative is to dramatically increase walking and cycling through a major reallocation of street space to these active travel modes. Measures for new cycle and pedestrian lanes have recently been proposed by many cities including Milan, Paris, Brussels and Bogota, and are being widely discussed in many more. The aim is to provide safe and healthy travel alternatives to increased car use, and to enable cities to continue to function with public transport restrictions. London Mayor Sadiq Khan has joined these progressive cities by advocating an active travel transformation for London with the Streetspace for London plan.
London’s Fragmented Cycle Routes
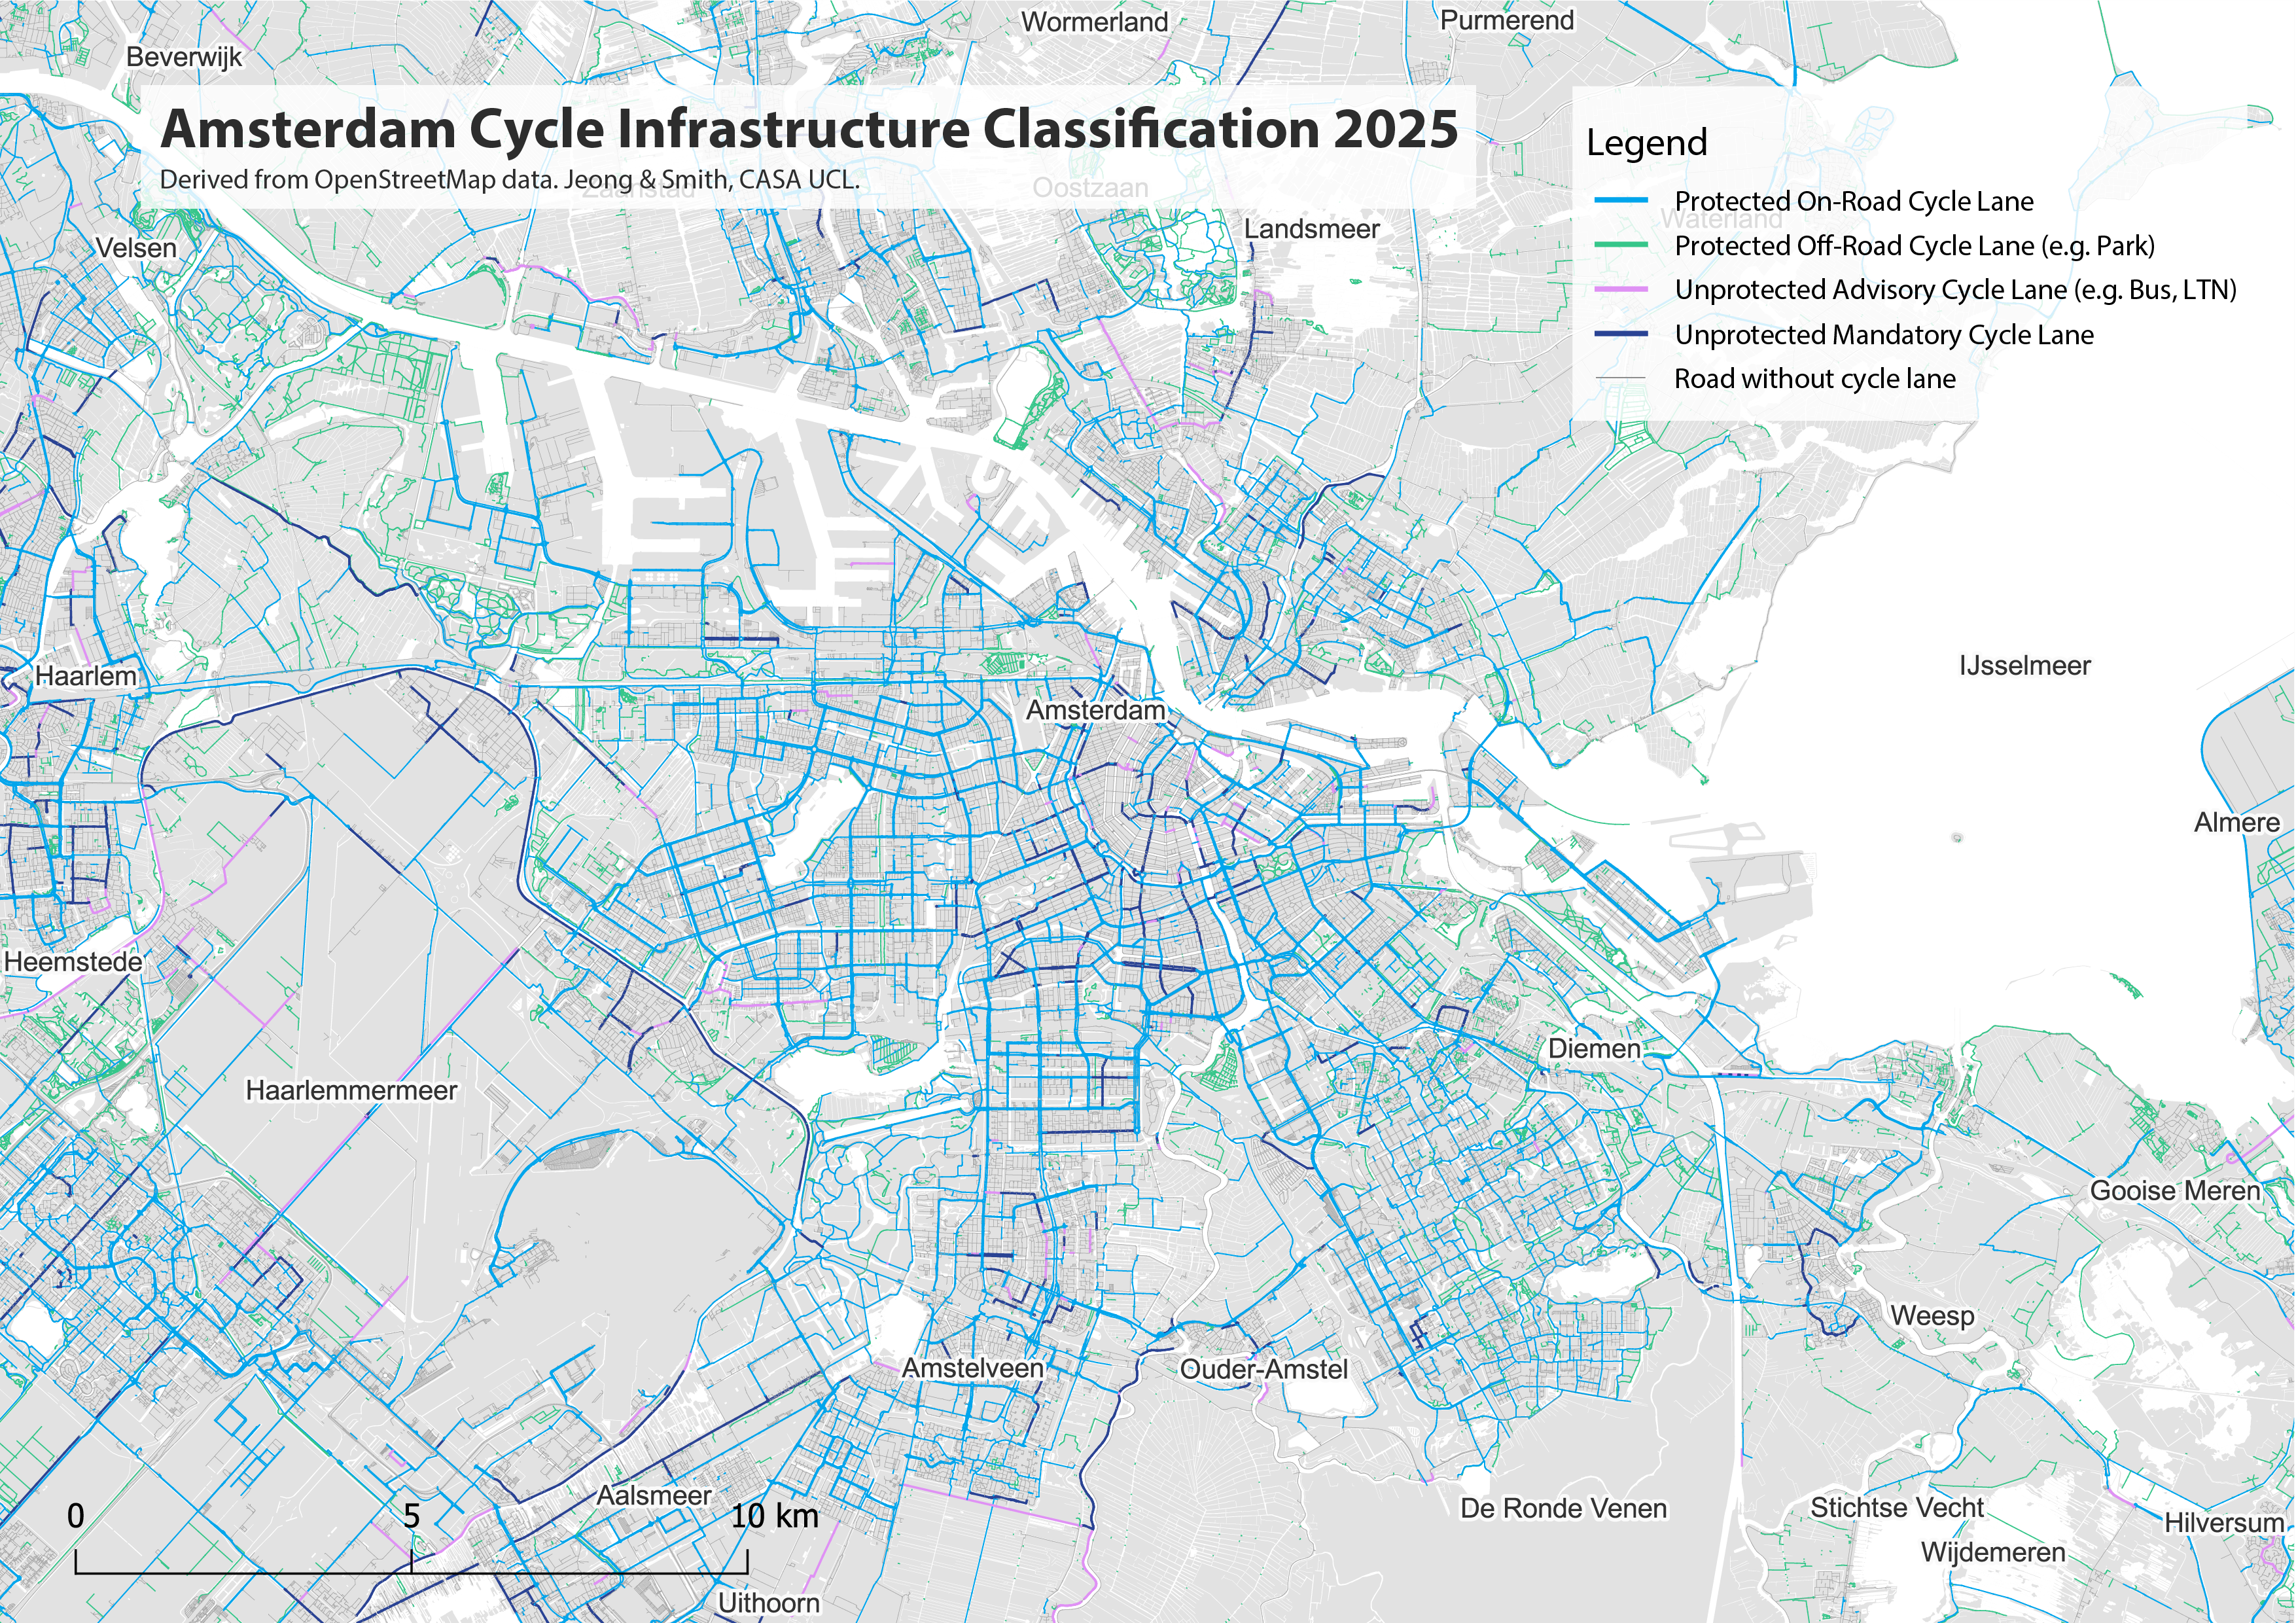
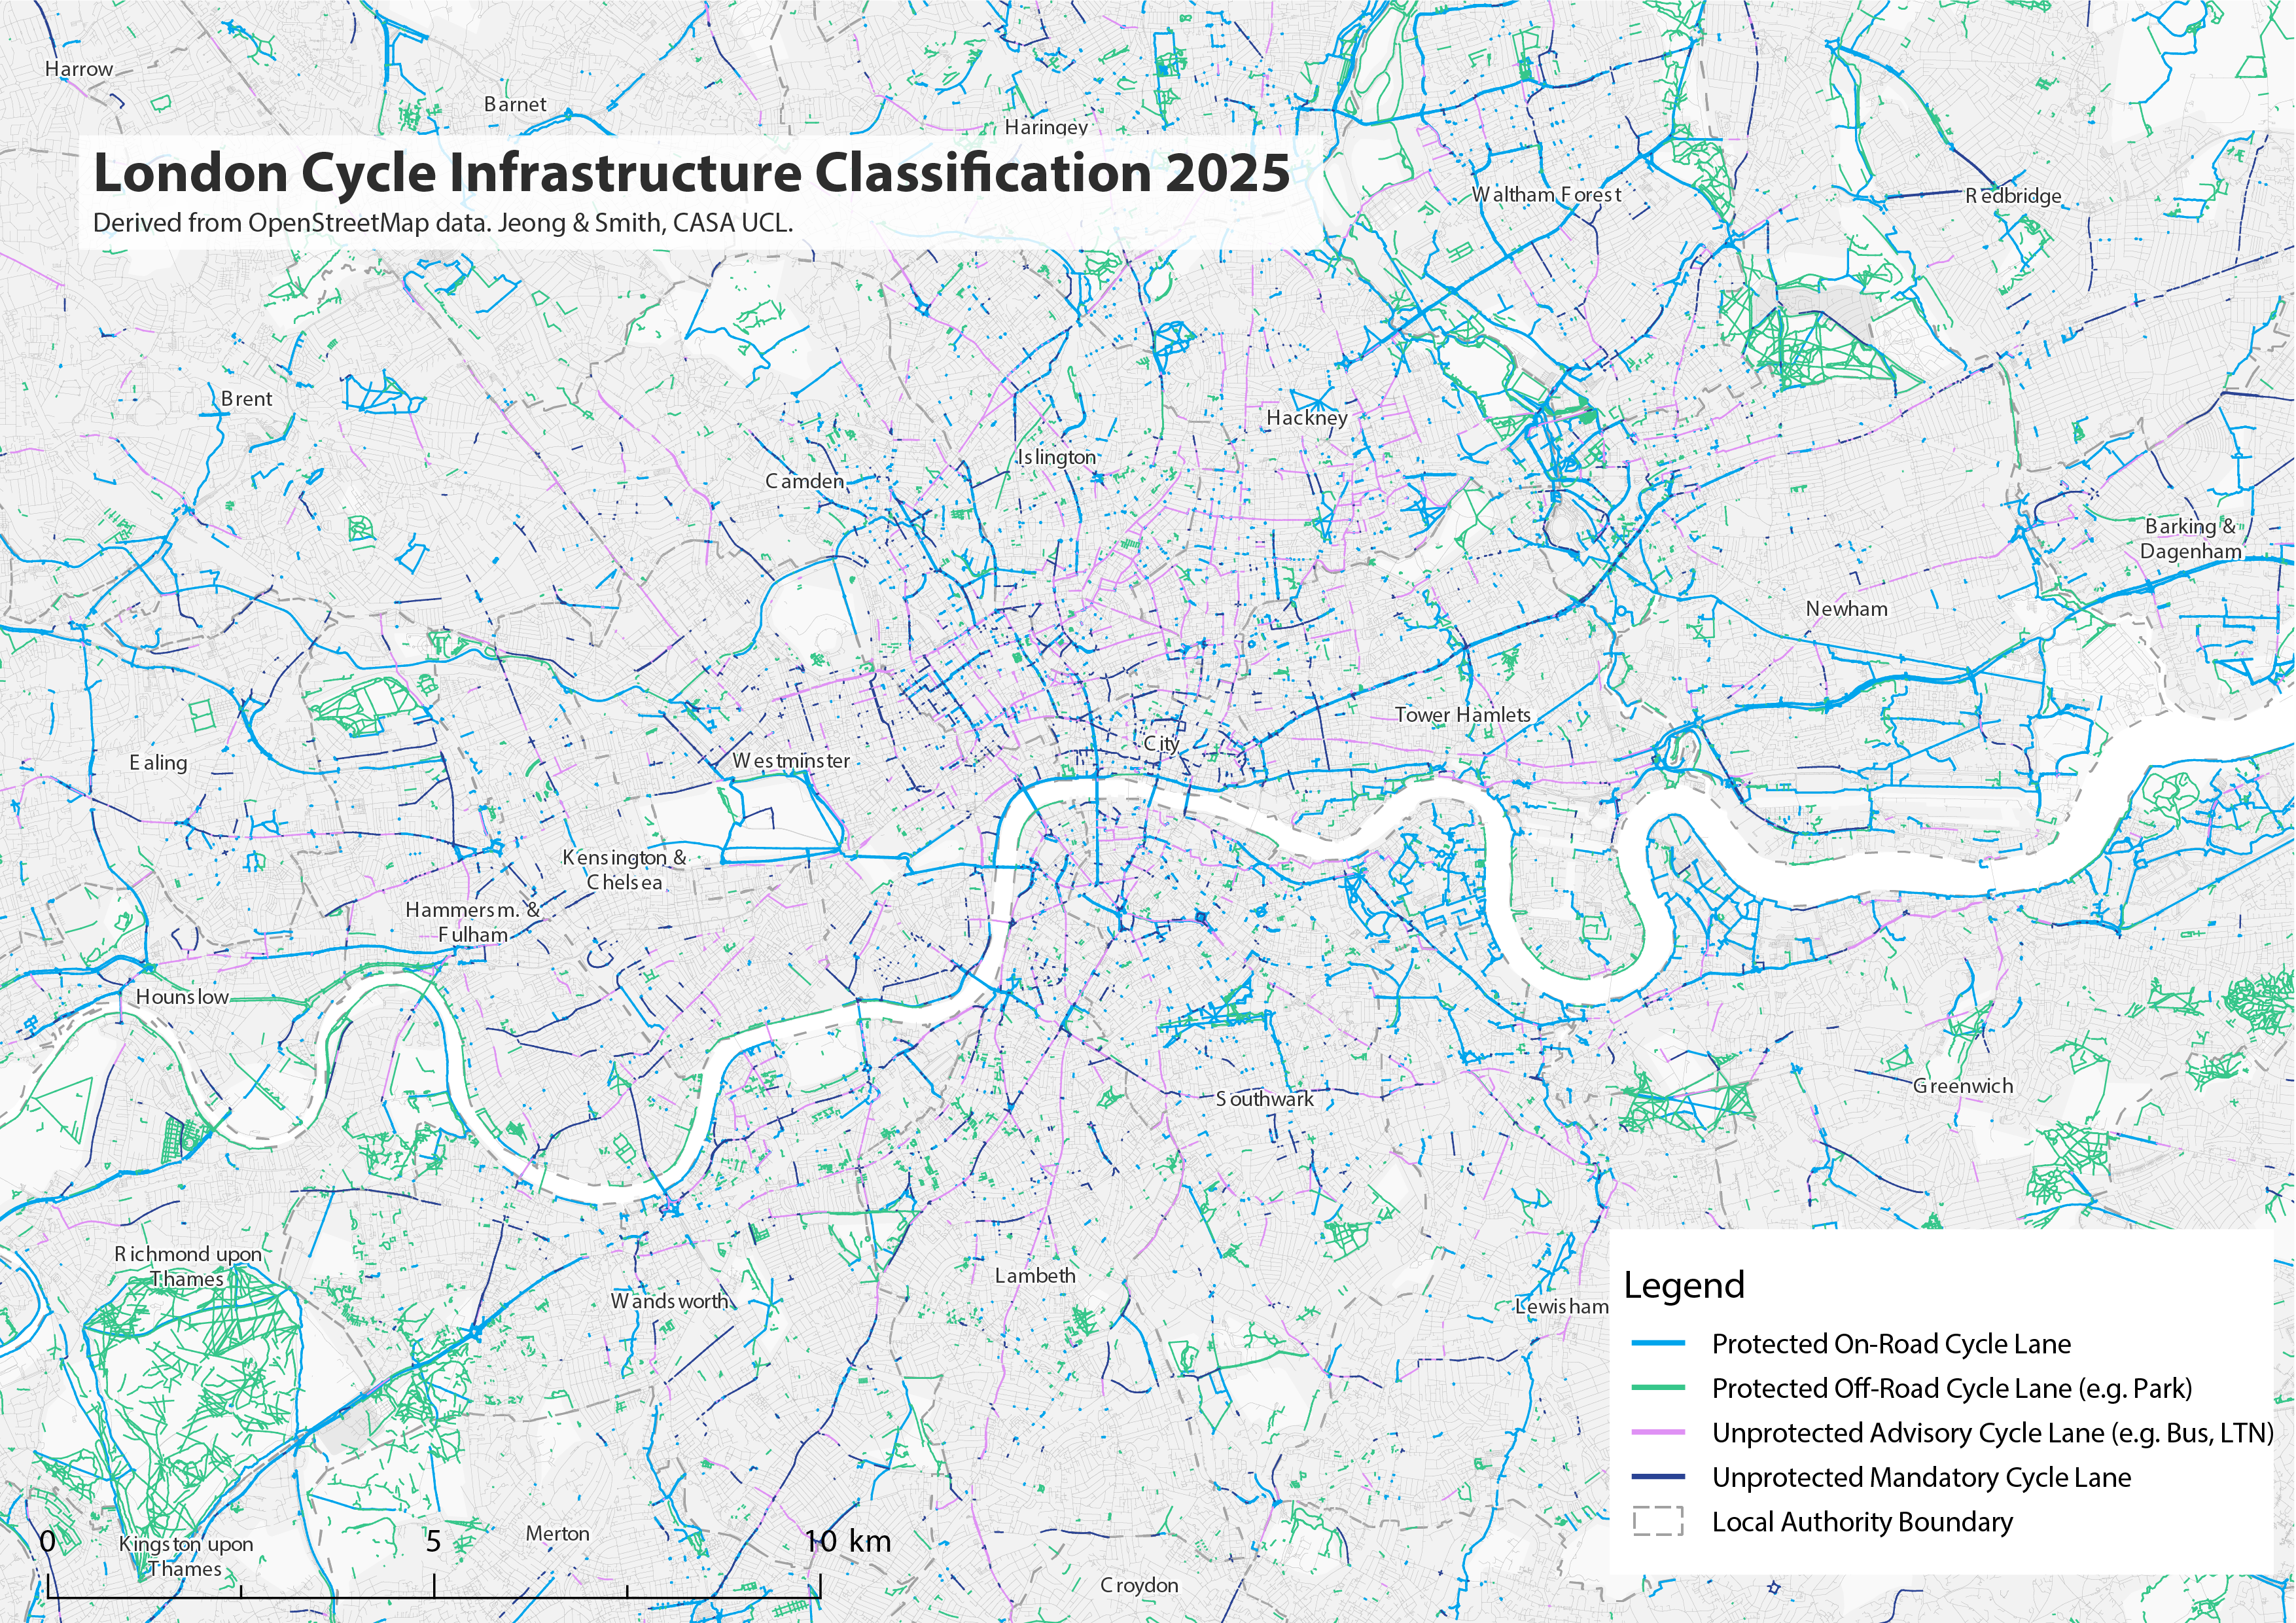
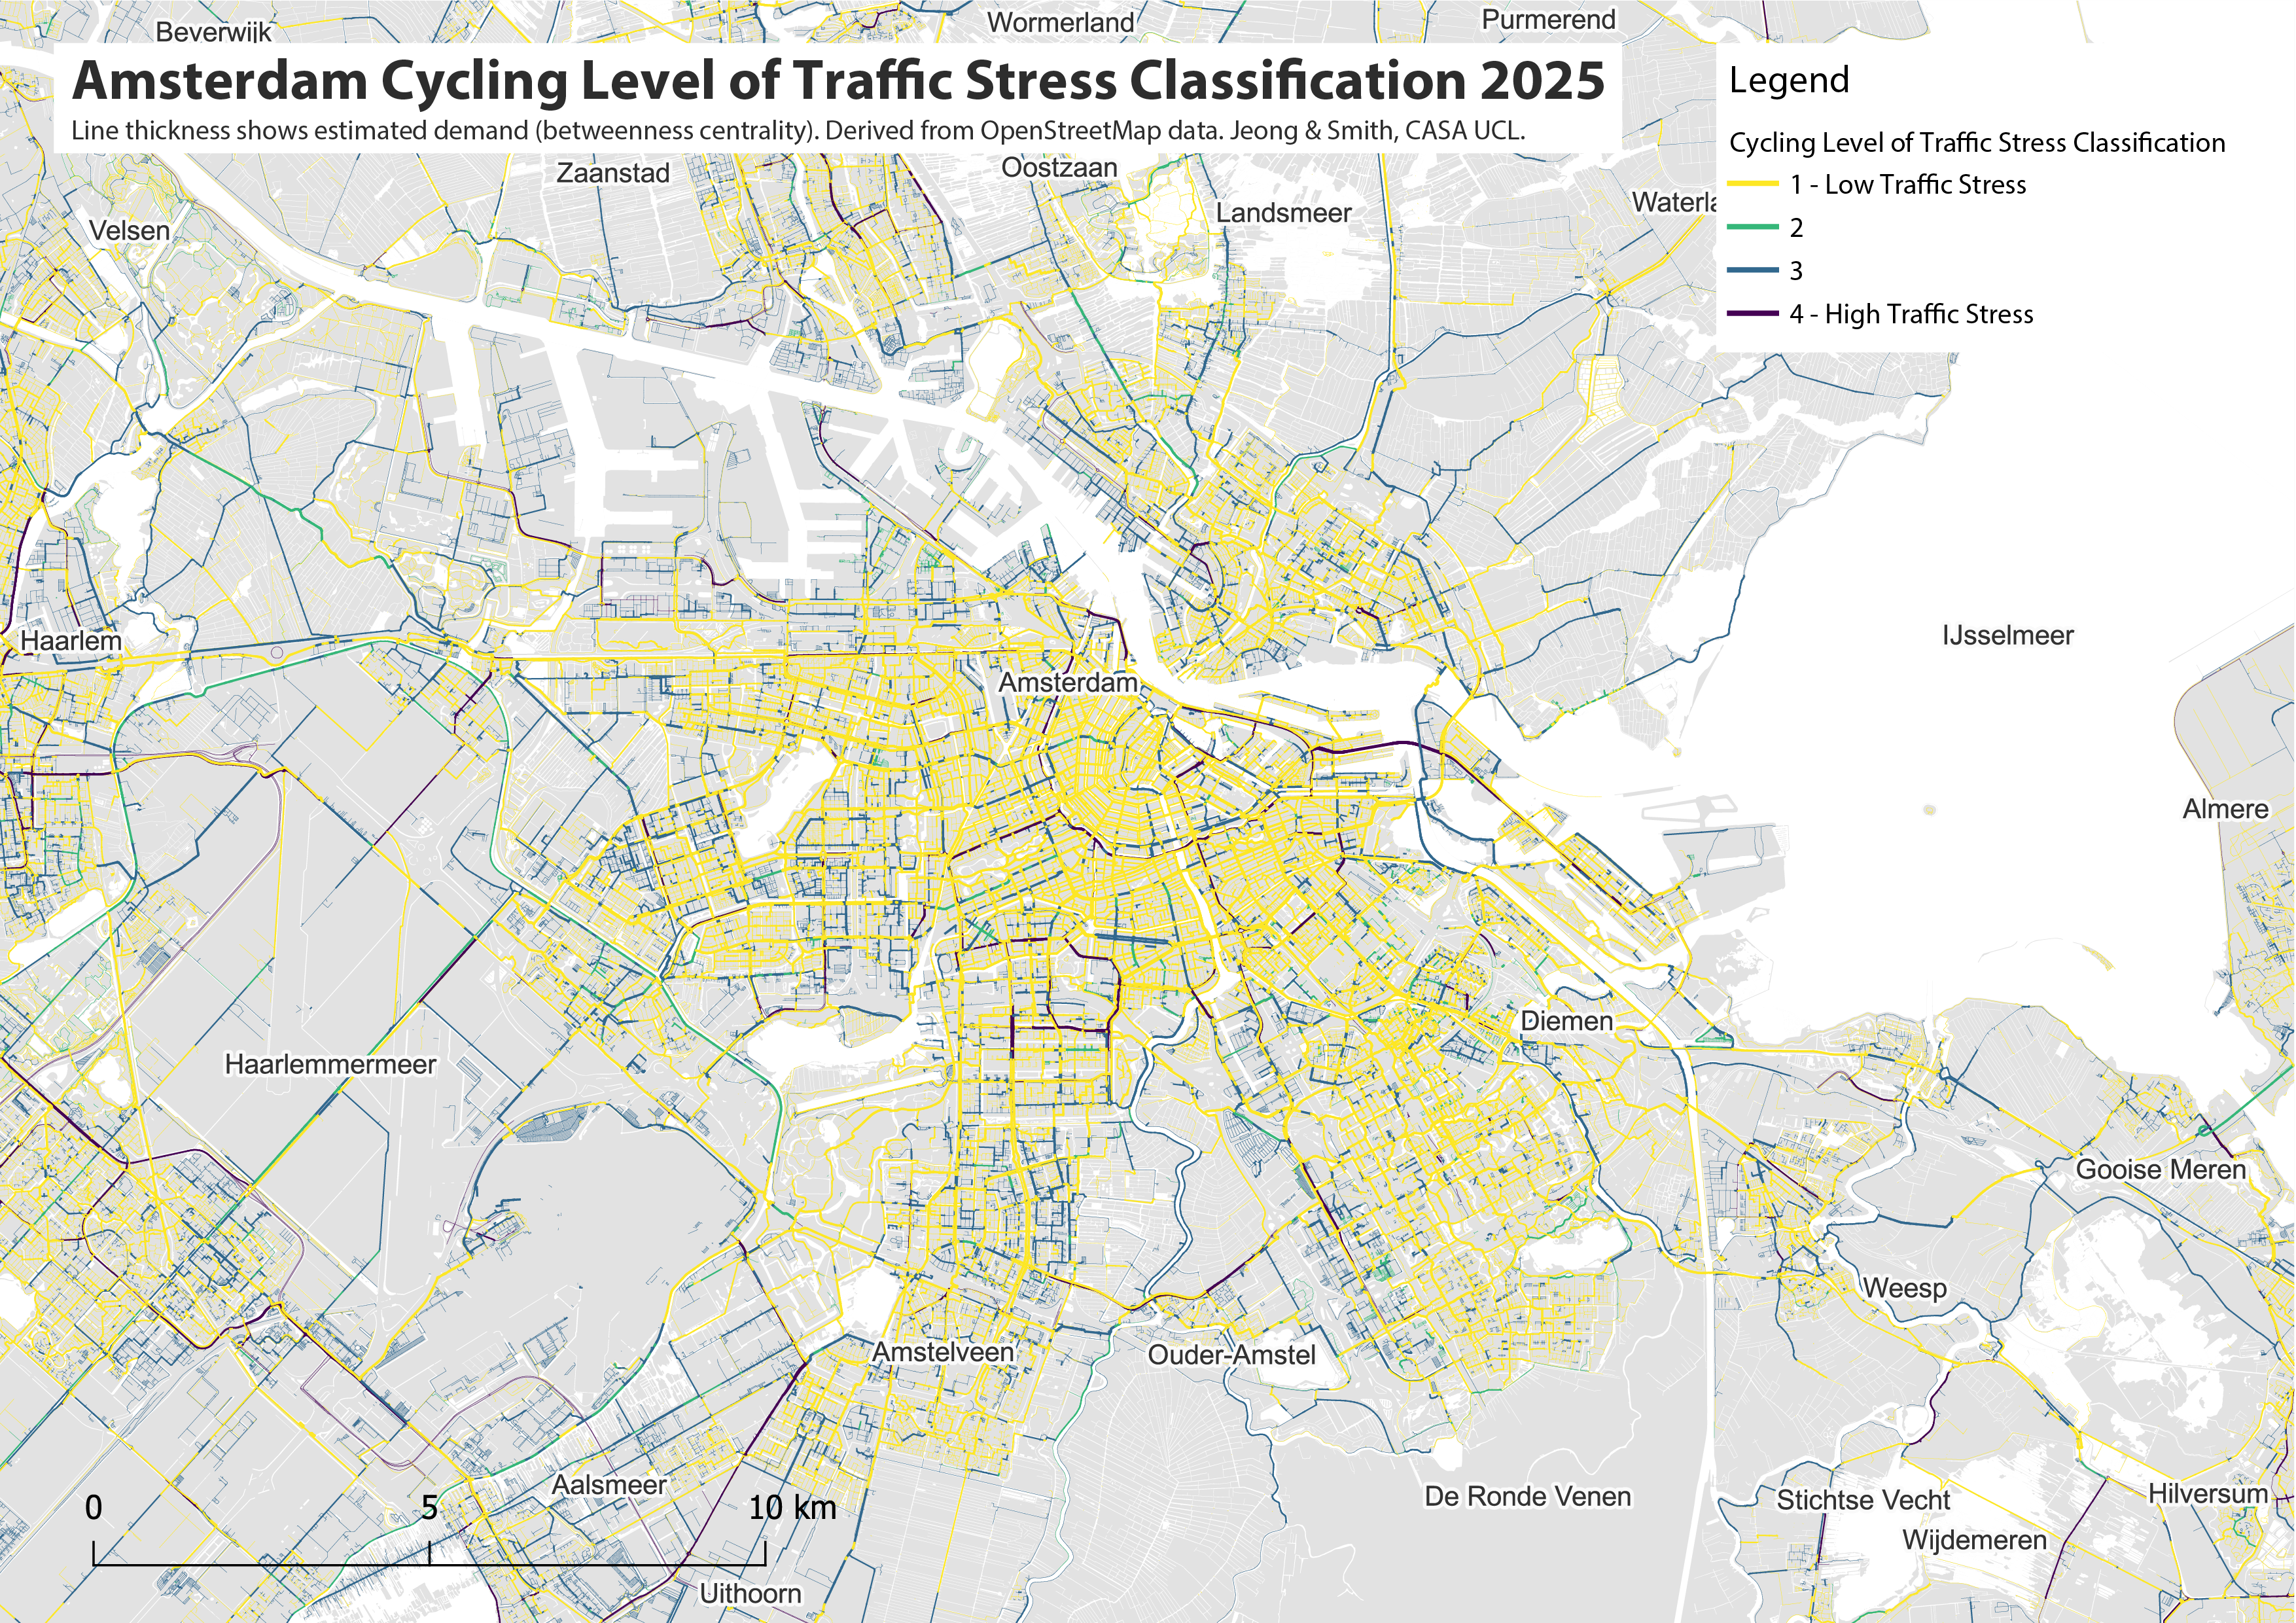
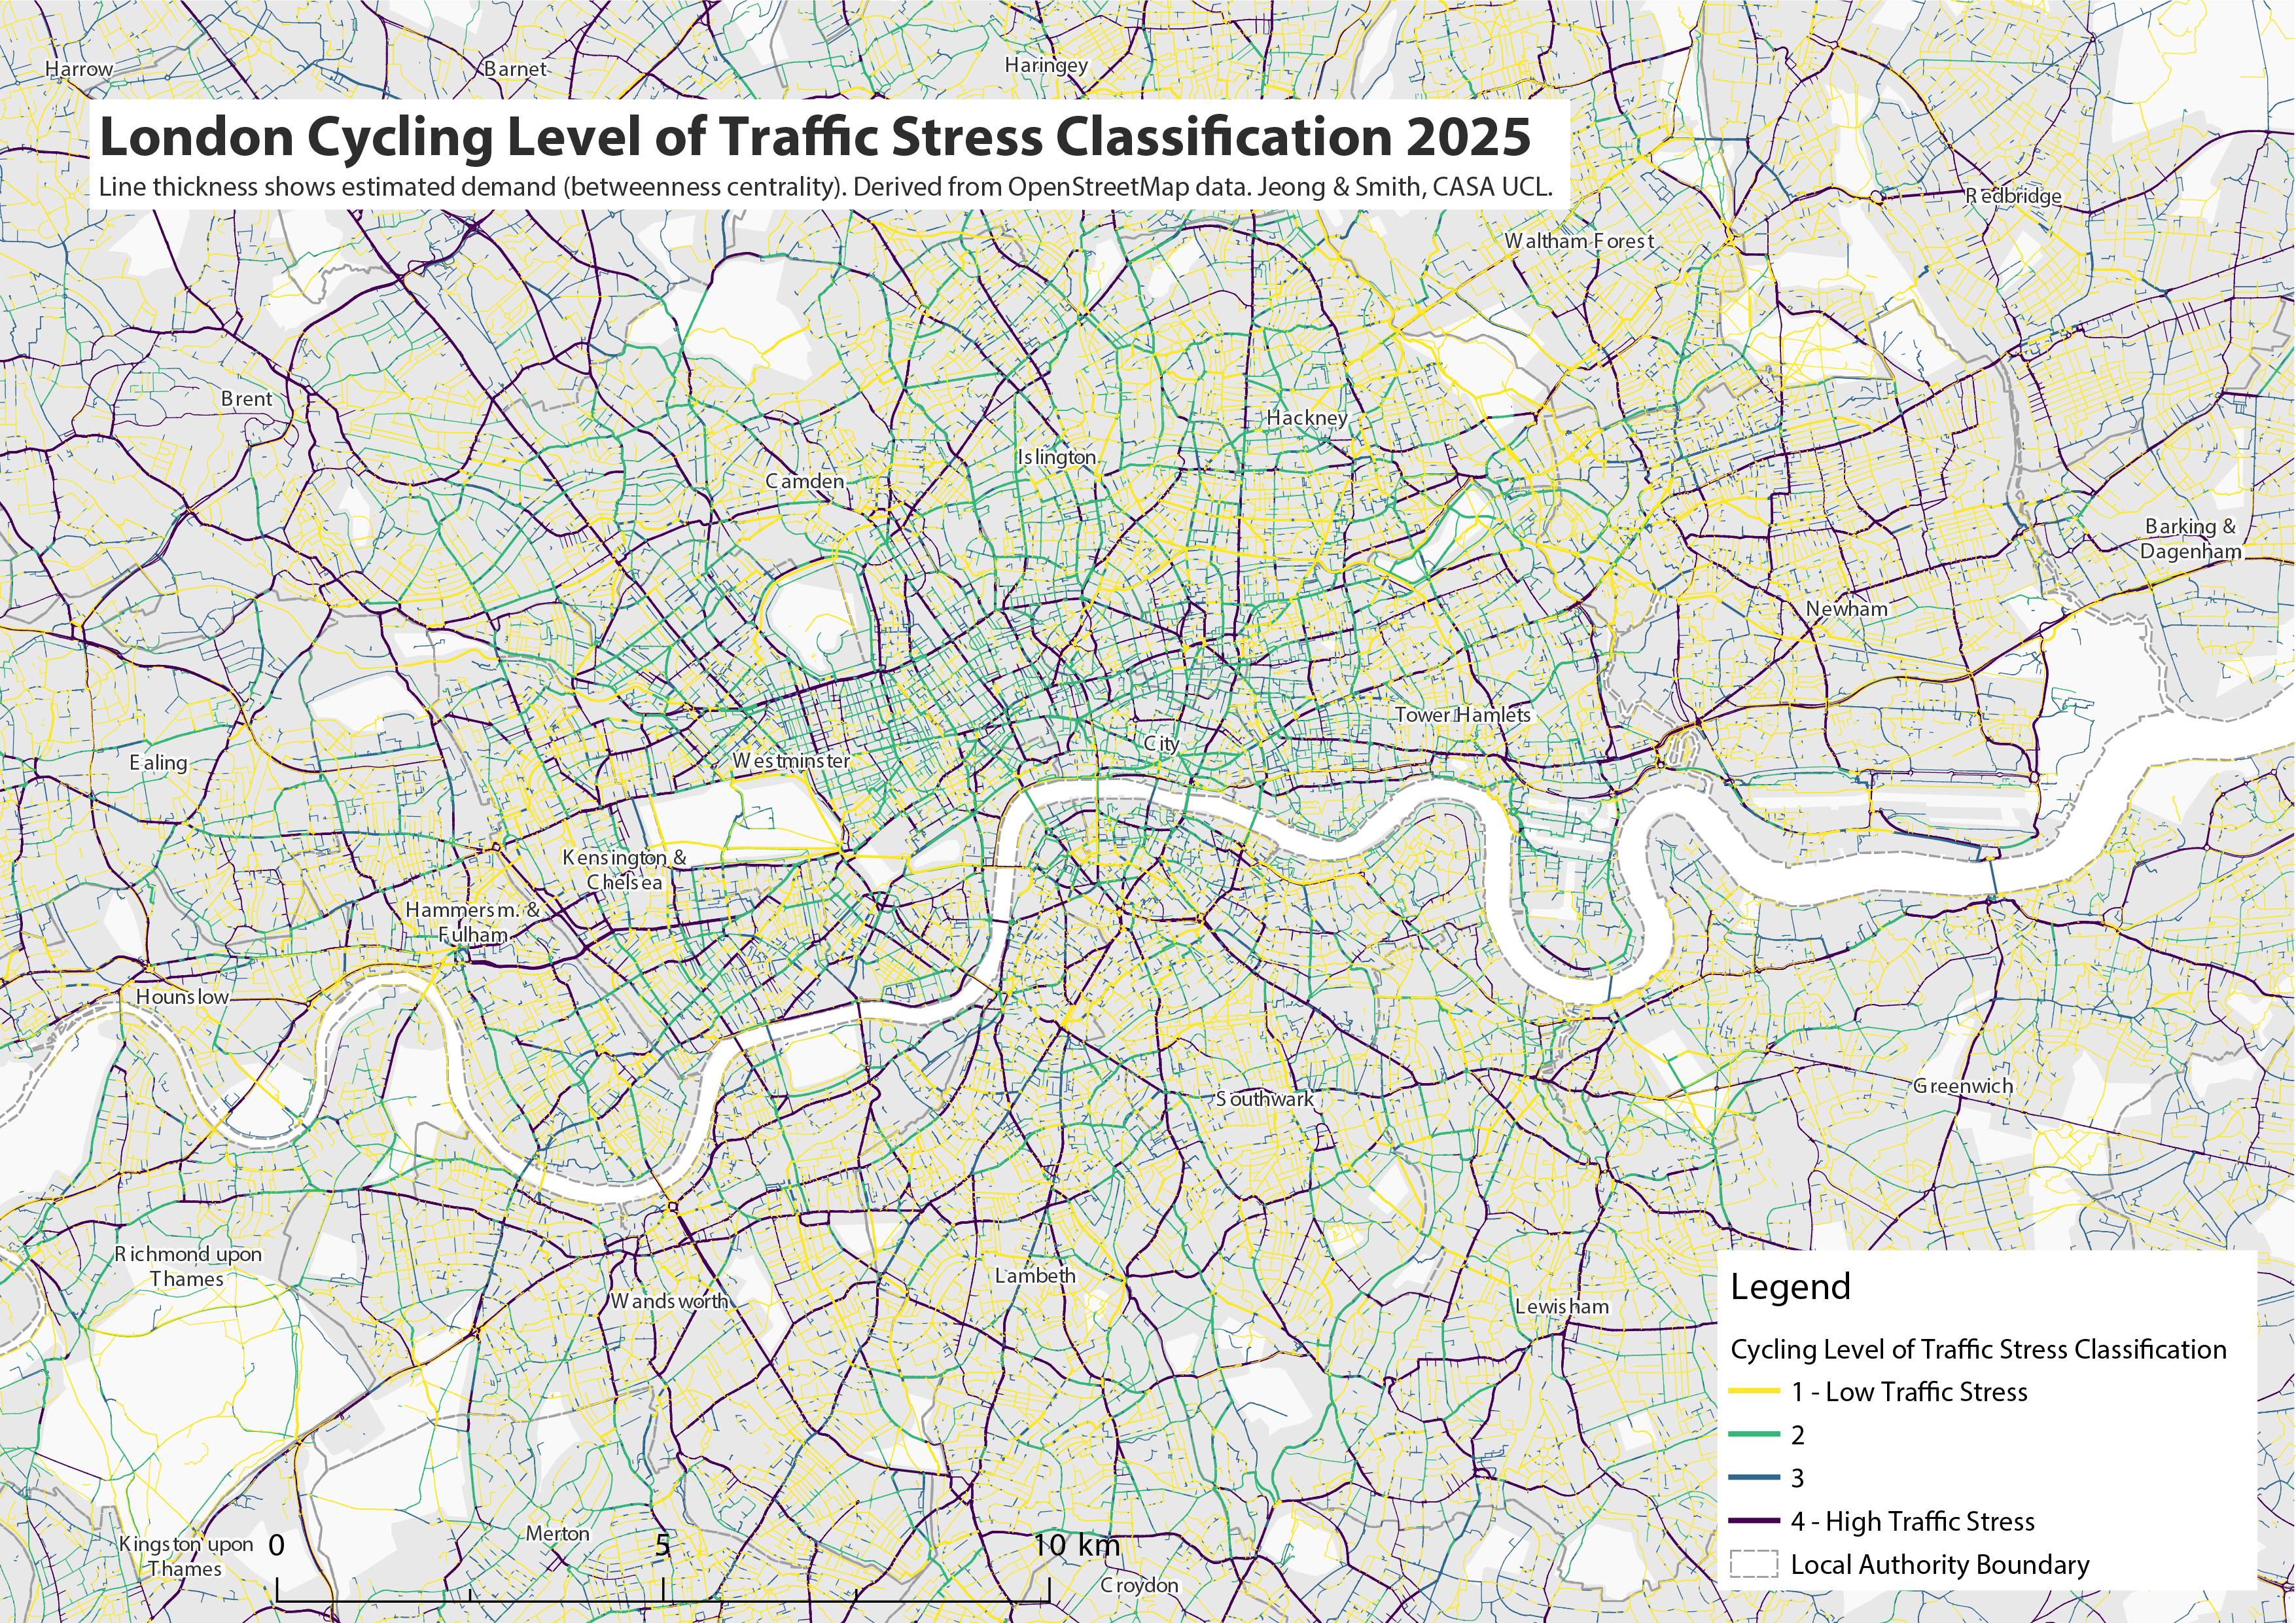
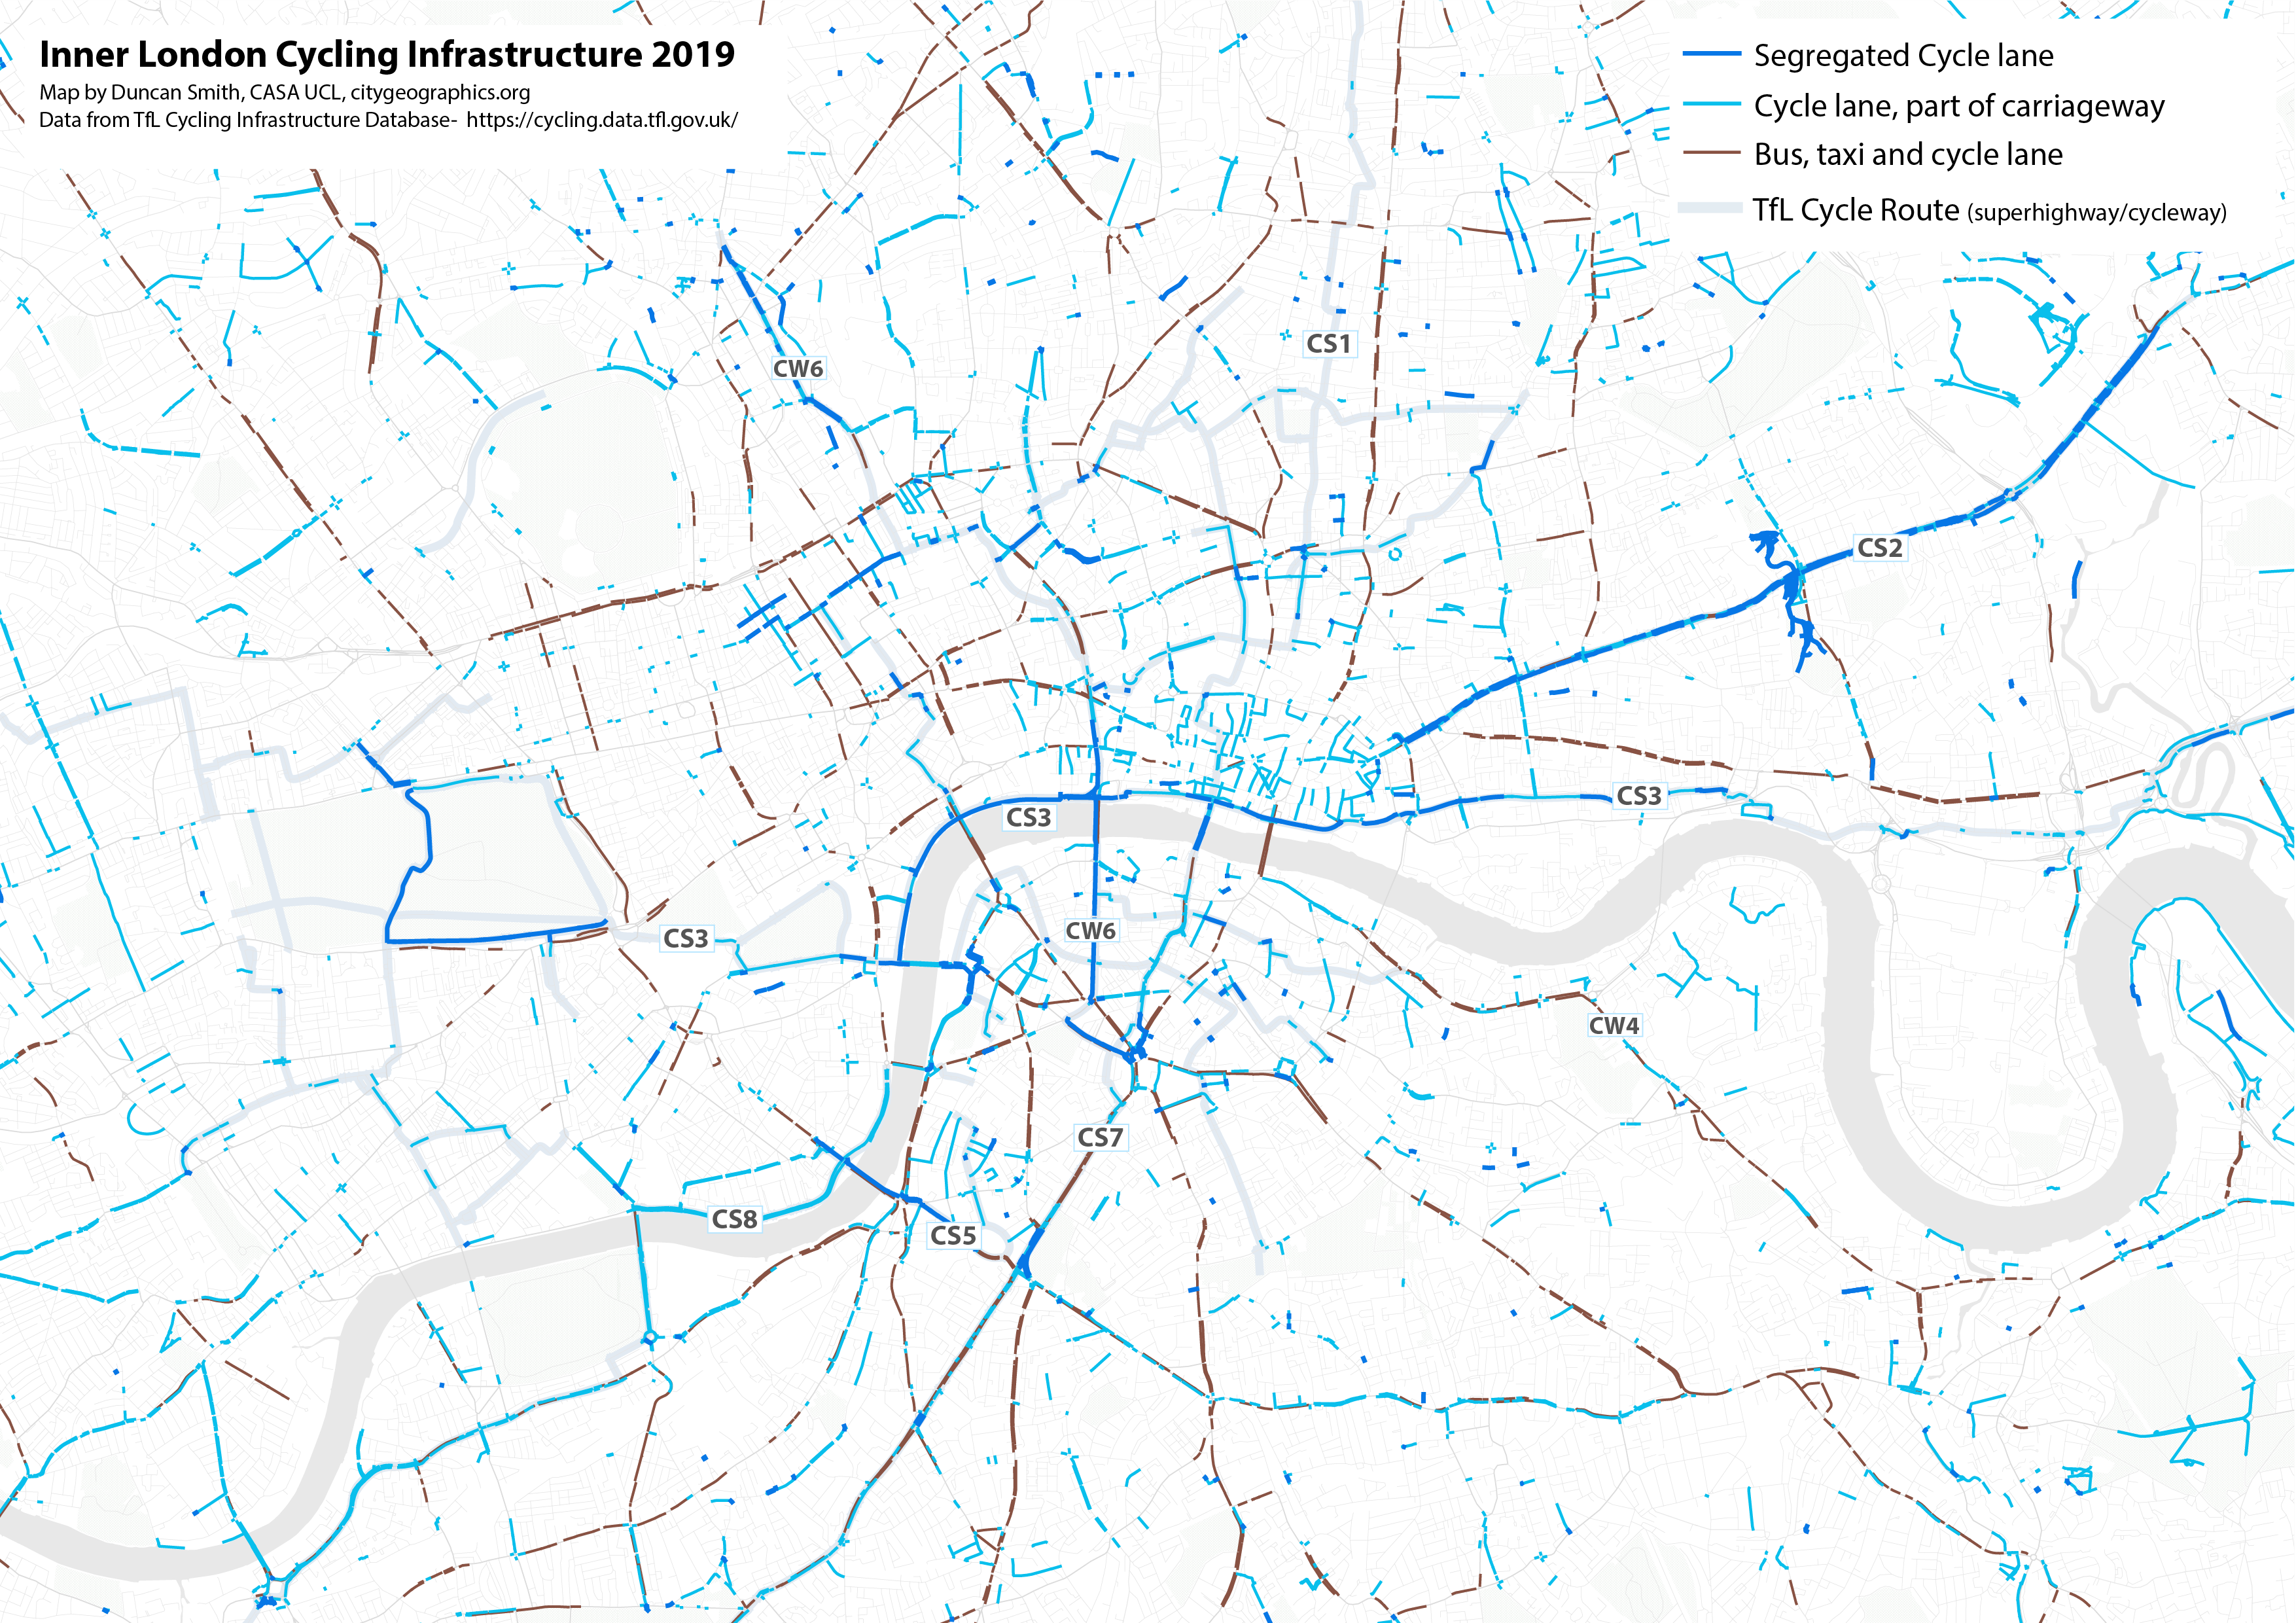
Cities that have achieved very high rates of cycling, such as Amsterdam and Copenhagen, have done so with comprehensive networks of segregated cycle lanes, allowing all residents to cycle safely, not just experienced cyclists. London has been struggling to catch up with these cities, and still has a fragmented and incomplete network of cycle lanes. The map below shows Inner London cycle lane data in 2019. The dark blue lines are physically segregated cycle lanes (i.e. a physical barrier between the cycle lane and the road). These are mainly found on CS2 (Cycle Superhighway 2) in East London, CS3 (the only complete East-West route through Central London), and parts of CW6 (Cycleway 6) which is the main north-south link across Blackfriars Bridge that has some sections in Central London that are still under construction.

Outside of these segregated routes there is a scattered patchwork of cycle lanes that are based on road markings without a physical barrier with the carriageway, shown in light blue on the map. There are also bus lanes on many major roads (dark red on the map) which offer some protection for cyclists, but are a long way from the safety of fully segregated lanes. Overall Inner London’s cycle network has many gaps that need filled, particularly in Central, West, North-West, North-East and South-East London. This infrastructure gap sits in sharp contrast to the aim of drastically increasing cycling during the post-lockdown period. The lack of segregated routes increases the risk of cycle collisions with cars, and will discourage public transport users from making the switch to cycling.
The Proposals from the Mayor and TfL
In the Streetspace for London plan, the Mayor has proposed developing a network of new walking and cycling routes to allow Londoners to walk and cycle while social distancing, and to redirect public transport trips to active travel rather than driving. Cycling will be critical for public transport substitution, as most tube and bus journeys are 4-10km, considerably longer than typical walking distances (discussed more below). Given the fragmented nature of current cycle routes, major changes and interventions are required to achieve these aims.
The highly ambitious nature of the proposals were made clear last week with a major plan for new Car Free routes to be introduced in the City of London (below). This plan would transform many of London’s busiest roads into bus, cycling and walking corridors, radically improving cycle access across Central London, particularly to major rail stations. It includes:
- Completing Cycleway 6 with a car free Farringdon Road leading to Kings Cross Station;
- A car free Waterloo Bridge, leading to a whole new car free north-south route via Kingsway and Southampton Row to Euston Station;
- A car free London Bridge, leading to two segregated routes, the first via Bank to Moorgate, and and the second via Bisohopsgate to Liverpool Street station;
- Upgraded east-west routes, with a car free Theobalds Road to Old Street; and improved cycle provision on High Holborn and Cheapside (could this be extended west to Oxford Street, and east to meet Cycleway 2 at Aldgate?);

These proposals show a comprehensive commitment to the active travel plan, and include major restrictions on driving to make this happen. In addition to the Car Free routes, the Congestion Charge and low emission zones have been reinstated, and the cost of the Congestion Charge will rise to £15, and hours of operation extended to 7am-10pm 7 days a week.
The Central London plan also shows that the City of London (the borough authority that controls London’s financial district) share the Mayor’s vision, as this proposal can only happen with their close cooperation. Indeed the City of London had already developed a longer term plan for removing cars from most of the City, and this proposal fits closely with their vision.
While Central London is vital for the Mayor’s active travel plans, the vast majority of journeys begin outside the City. Clearly a much wider vision for all of London is needed. TfL have stated they will create 30km of new permanent cycle lanes this summer. They have released a London-wide map of proposed new ‘Streetspace Routes’ on their website (below). While this map is very much in development (it does not yet have the City of London routes above added), there are several very significant proposals, including-
- Segregated cycle lanes on Euston Road- a vital busy highway connecting major rail stations (Paddington, Euston, Kings Cross), as well as linking to the north-south routes in the above Central London map. The Euston Road proposal extends all the way west to Acton;
- adding a further set of new routes in West London, including Cycleway 9 from Hounslow to Brentford and Kensington Olympia;
- speeding up the completion of CW4 from London Bridge to Greenwich and Woolwich in South East London;
- improving CS7 to Brixton and Clapham in South West London;
- completing a North-West link from Regents Park to Golders Green;
- adding a new link from Hackney to Canary Wharf;

Predicting Where Cycling Demand is Likely to be Highest
While there are lots of excellent proposals in the TfL map above, it does not yet form a complete network (it also does not differentiate between the quality of existing cycle routes which are highly variable). We can use network analysis to consider where cycling demand is likely to be highest, and where new infrastructure should be prioritised. The analysis below by Nicolas Palominos at CASA is based on shortest paths between underground and rail stations, and is indicative of where active travel trips are most likely to be made if passengers are prevented from taking the tube/bus/train (see full working paper here). The map highlights the core network of Inner London’s most prominent links, including its oldest Roman Roads- Edgware Road, Kingsway, Oxford Street. Promisingly, there is considerable overlap between these critical shortest path routes and the cycle network proposals by TfL. We can see the importance of the new north-south Waterloo Bridge-Southampton Row link for example; Euston Road’s importance is clearly shown; as is Theobald’s Road to Old Street. TfL have completed similar analysis in their Strategic Cycling Analysis from 2017, and we can assume this is guiding their plans.

There are however some important links missing highlighted through the network analysis. The most significant missing link is London’s most important east-west route that runs along Hyde Park through Oxford Street all the way to Cheapside and the City (following the route of the Central Line). The City of London proposals cover the eastern section of this vital route, from High Holborn to Bank. There needs to be similar cycling upgrades for the western section: Oxford Street, Bayswater Road and Holland Park Avenue. This intervention requires the Mayor to cooperate closely with the City of Westminster authority. Politically this is difficult, as Westminster has been blocking high profile proposals from the mayor in recent years, most notably the pedestrianisation of Oxford Street. Coming to some agreement will be essential for the western expansion of the cycle network to be joined together effectively.
Other key routes that are not yet part of the proposals include Edgware Road; Peckham Road; Essex Road; Old Kent Road; City Road; Commercial Street; Kingsland Road; and Seven Sisters Road amongst others. These are discussed further in the working paper. Edgware Road is currently the main north-south driving route that avoids the Congestion Charge, and giving space to cycling would be difficult to implement here (although Park Lane is included in TfL’s plans, and indeed the Park Lane cycle lane is already installed on the western carriageway adjacent to Hyde park). The Swiss Cottage to Golders Green link looks like the proposed north-west alternative to Edgware Road, and would benefit from completion through Regents Park to the Euston Road link. The network analysis strongly agrees with the Euston Road cycle provision, though in this analysis this critical link continues further to Pentonville Road, City Road and Commercial Street encircling the City.
Overall, the TfL Streetspace proposals look very promising, and need to be further linked together and expanded as discussions with more boroughs continue. This will also need much more emphasis on Outer London centres and local shopping and school routes, important topics which are not covered in this article.
Estimating the Number of Cycling and Walking Trips Post-Lockdown
What might the the number of trips by different travel modes in London look like in the coming months? This is highly uncertain. Some modelling figures from Transport for London quoted in press releases are anticipating radical changes in behaviour, up to a ten times increase in cycling trips, and up to a five times increase in walking trips. Are these figures realistic?
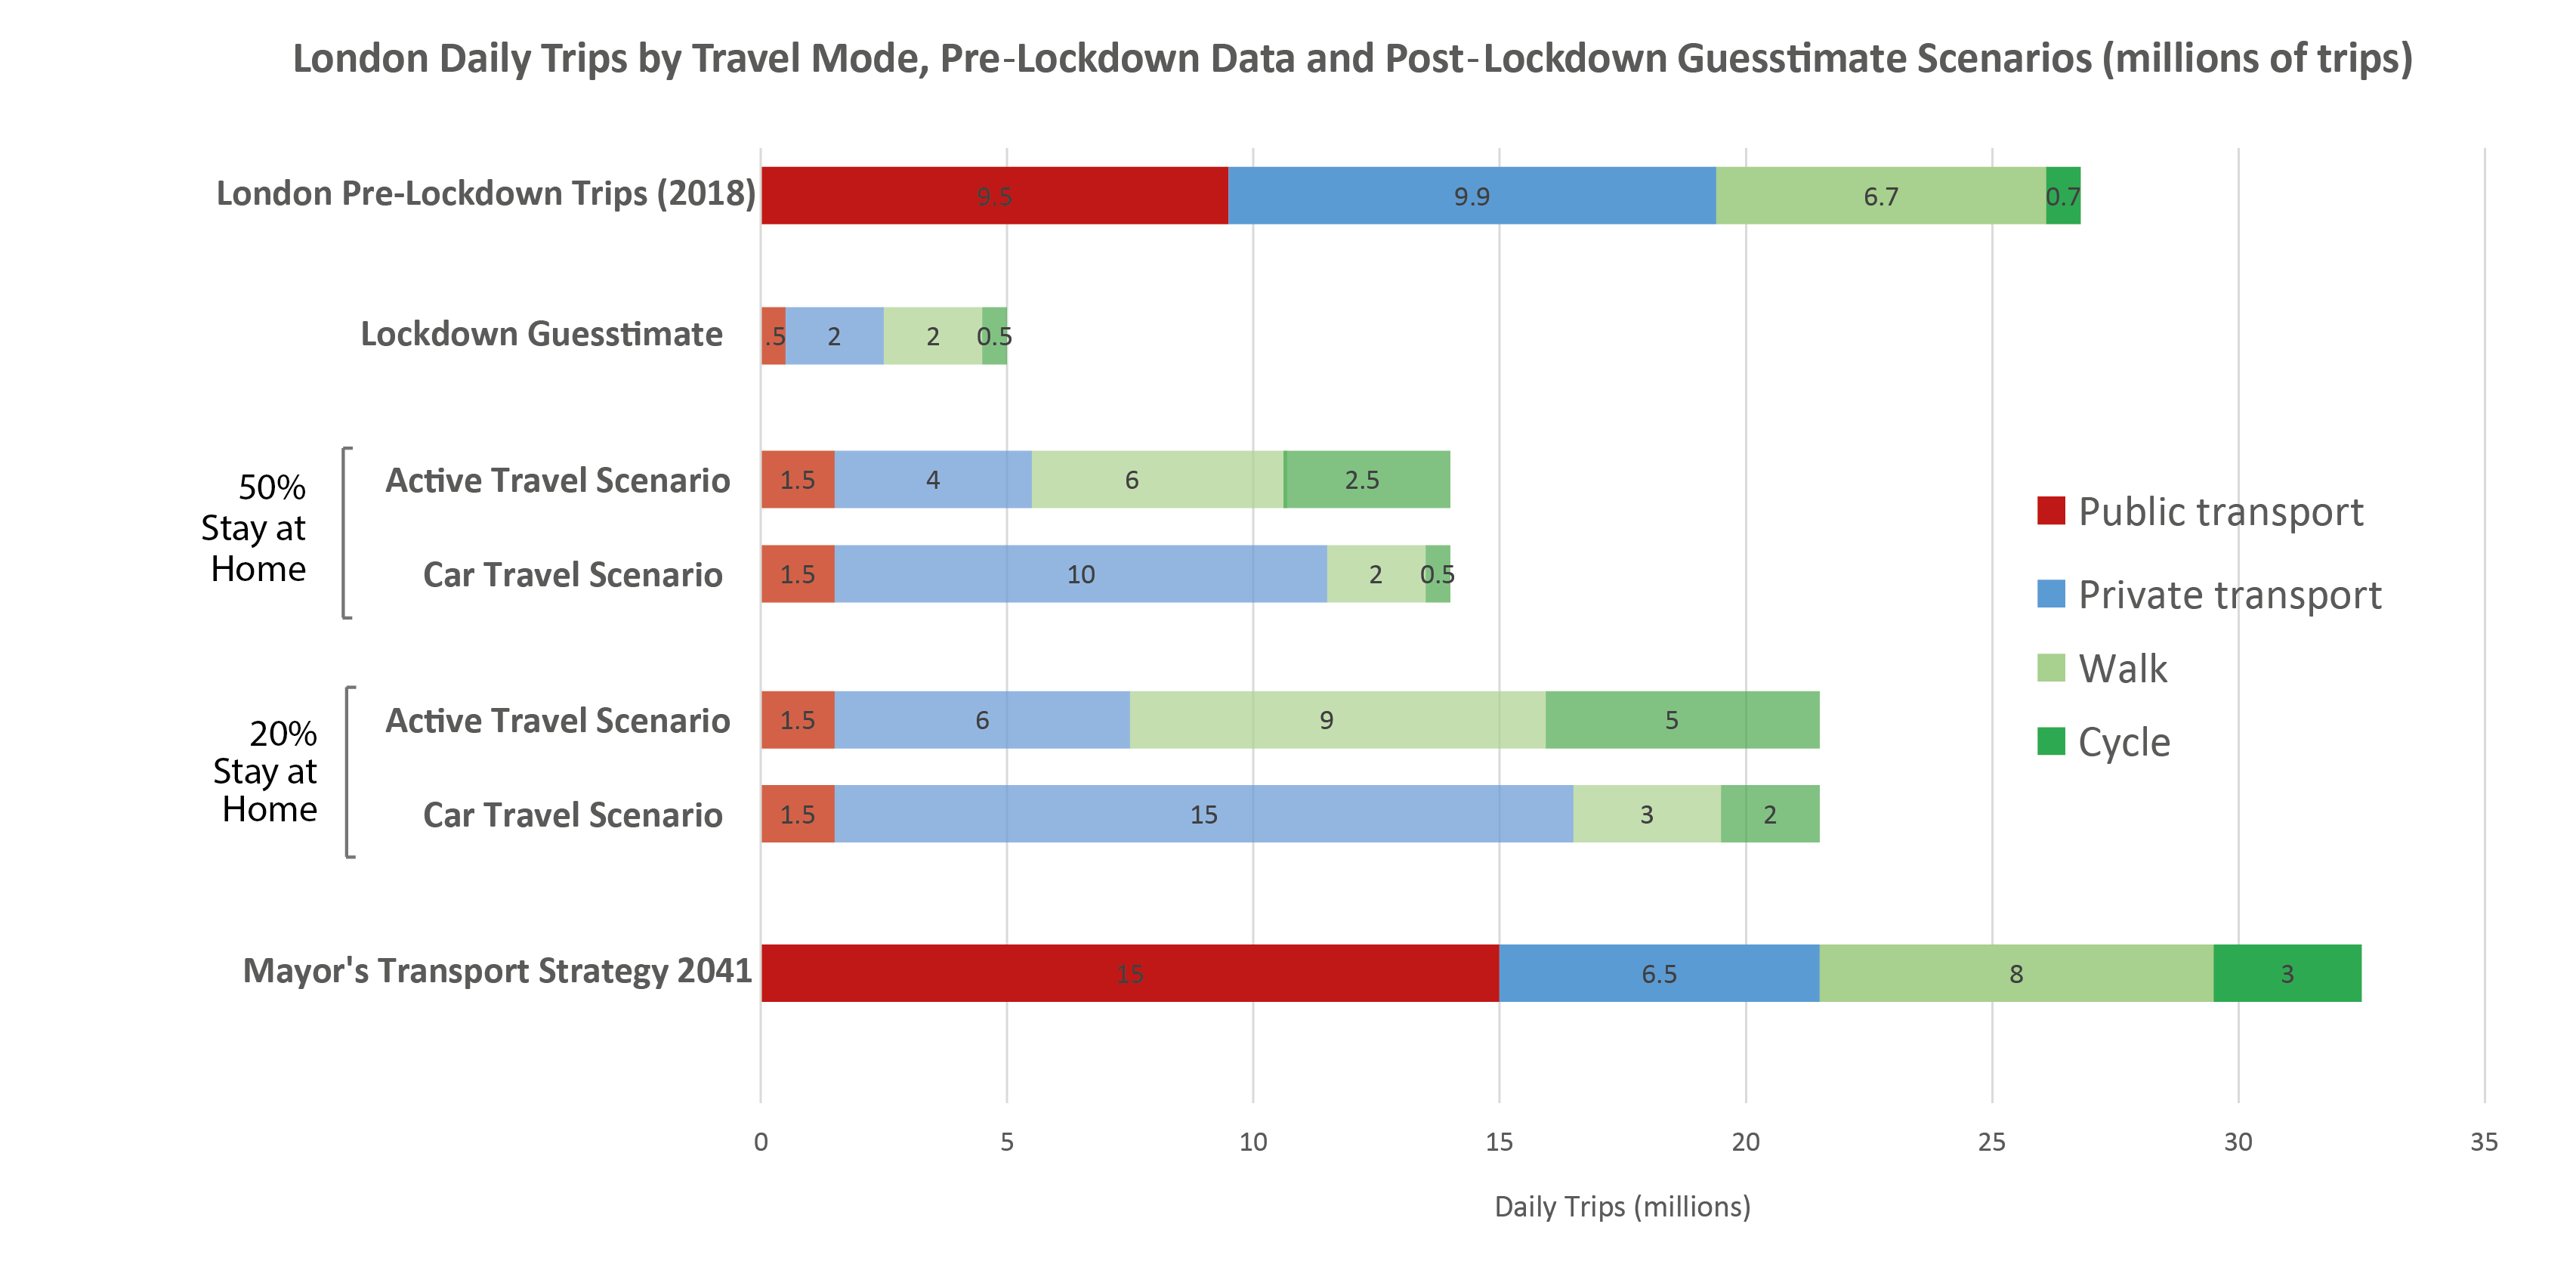
The chart below shows the distribution of trips pre-lockdown (from TfL Travel in London Report 12), and a series of post-lockdown guesstimate scenarios to discuss where we might be heading. Normally in London we are looking at around 27 million trips per day, with 9.5m by transit, 10m by car, 7m by walking and 0.7m by cycling. The lock-down figures in the chart below are based on TfL’s statement that underground passengers have been at 5% of normal levels, and car traffic has been radically reduced (though is picking up more recently). We don’t know overall walking and cycling levels during lock-down, but given workplaces, schools and most shops are closed, they have likely fallen.

What happens next is massively uncertain. During the lockdown, everyone except for key workers have been staying at home. This will change as the lockdown lifts, depending on the percentage of people who continue to stay at home. There are various reasons for continuing to stay at home: working from home; looking after children at home (particularly if schools remain closed or are only partially opened); and people who are furloughed or become unemployed. Two scenarios are shown above, with 50% of people continuing to stay at home and 20% of people continuing to stay at home. The 50% figure is likely to be closer to reality for at the least the next few months, with infection rates still significant and most schools and workplaces still closed.
Using the 15% social distancing capacity limit estimated by TfL, we can see that 8 million daily public transport trips (or 4 million return trips) can no longer be made. The question then is what happens to these trips. The Active Travel scenarios shown above are based on a big increase in cycling and walking trips remaining constant or increasing. The Car Travel scenarios in contrast estimate what will happen if these trips do not switch to active travel, and significantly more driving occurs. This results in more car trips than pre-lockdown and consequent problems of increased congestion and air pollution.
How realistic is it to assume that public transport trips could switch to active travel modes? One basic way to consider this is using average trip distances by travel mode, as shown below. It is clear that National Rail trips are often long distance, and substitution with active travel is likely going to be unrealistic for most of these trips. This seems to be the assumption in the TfL plans, as the Car Free Streespace corridors prioritise linking up the biggest mainline railway stations. The idea is that mainline rail trips will change the next leg of their journey to cycling and walking, rather than tube or bus. There will likely be significantly more demand for cycle parking/hire facilities at stations and for taking bikes on trains.
The most popular public transport mode in London is the bus, and bus trip lengths are very close to average cycling trip lengths, so prospects for active travel substitution are much better for these trips. Average Underground distances of just under 10km are potentially workable as cycling trips of around 30-40 minutes (or quicker with electric modes), so some substitution is possible for these trips. The network analysis in the working paper found average trip lengths for shortest path between stations in Inner London to be just over 10km. The extent to which public transport trips can be substituted with walking trips is highly questionable for distances above 5km, as this will take most pedestrians an hour or more. The average walking trip in London is less than 1km. This likely makes cycling the key active travel mode for most public transport substitution, as well as there being significant opportunities for expanding recent micromobility options such as e-bikes and e-scooters.

Summary
The Mayor and Transport for London have proposed a radical Streetspace for London plan to redirect trips to walking and cycling as we move out of lockdown, and try to avoid a huge increase in car trips due to social-distancing capacity limits placed on public transport services. The Mayor and his team are essentially using this crisis to rapidly speed up active travel plans for London that were on the drawing board for the next decade. These plans are not empty words, they are backed up with a comprehensive transformation of many Central London routes to car free routes, as well as further restrictions on car use through the Congestion Charge. These measures are already being implemented.
At present, the proposed cycle network has lots of excellent proposals, yet remains incomplete, missing key links such as Oxford Street, as well as lacking proposals for linking Outer London centres. The proposals require support from London’s borough councils to be developed, and so far have support from key boroughs such as the City of London (with other pro-cycling boroughs such as Hackney and Camden also likely to be supportive). Hopefully more agreements will be reached with boroughs such as Wesminster, otherwise the new streetspace links will miss key parts of Inner London.