The pandemic and subsequent lockdowns have seen the largest and most sustained disruptions to travel behaviour in most of our lifetimes. Stay-at-home policies have fuelled a dramatic increase in remote working, and wider online substitution of other activities such as shopping and socialising. In sustainability terms, the pandemic has severely hit public transport and incentivised car travel, but has also likely reduced travel distances overall as well as encouraging new patterns in active travel. The big question is to what extent pandemic related changes are turning into longer term shifts in travel behaviour patterns.
This post looks at timeseries travel data across the last three years, and then summarises results from the recently published National Travel Survey data 2021 for England, with a particular focus on trip purpose and differences between London and England as a whole.
Transport Use Timeseries Data from DfT
The Department for Transport have continually updated a very useful timeseries on how busy different transport modes have been in England throughout the pandemic. This index integrates many different datasets and is intended as a broad summary of trends (see methodology here). The graph below summarises this data, which is indexed to February 2020. The overall picture is of huge disruption in 2020, continued disruption with a transition towards recovery in 2021, and then what looks like settling into a new normal in 2022.
The chart paints a mixed picture in sustainability terms. Car travel has been the fastest transport mode to recover after each of the national lockdowns, and was back to near normal levels as early as summer 2021. While this is a challenge going forward, it could potentially have been worse. The pandemic could have resulted in substantial increases in car travel. Instead, there is a minor reduction to about 96% car use in the DfT data, sustained into 2022 (in per-capita terms this reduction will be more substantial given population increases). Note the motorised vehicle index that includes freight reaches 100% of pre-pandemic levels in 2022, possibly due to more online delivery traffic.
Public transport has been much slower to recover, falling to less than 50% of passenger numbers in 2020, increasing substantially throughout 2021 and then settling around 70-85% of pre-pandemic passenger numbers in 2022. Rail and tube travel were hardest hit in 2020 due to the widespread fall in commuting and these modes have taken longer to recover than bus travel. It is difficult to gauge whether public transport levels have now levelled off around the 75% level, or will continue to recover further in 2023 (the rail and tube strikes in summer 2022 may have curtailed further increases).
A positive sustainability story comes from the cycling data from the DfT. This is a less reliable metric, but nonetheless indicates growth in active travel, albeit from a low base in 2019. The annual variation in cycling in the DfT data between 2020 and 2022 is interesting. The initial 2020 increase in cycling makes sense, as there was a big growth in active travel for households locked down in their local area. This falls to 2019 levels in 2021, and then rebounds in 2022. Perhaps the fall off in new cyclists has given way to more practical longer term adoption of cycling in 2022.
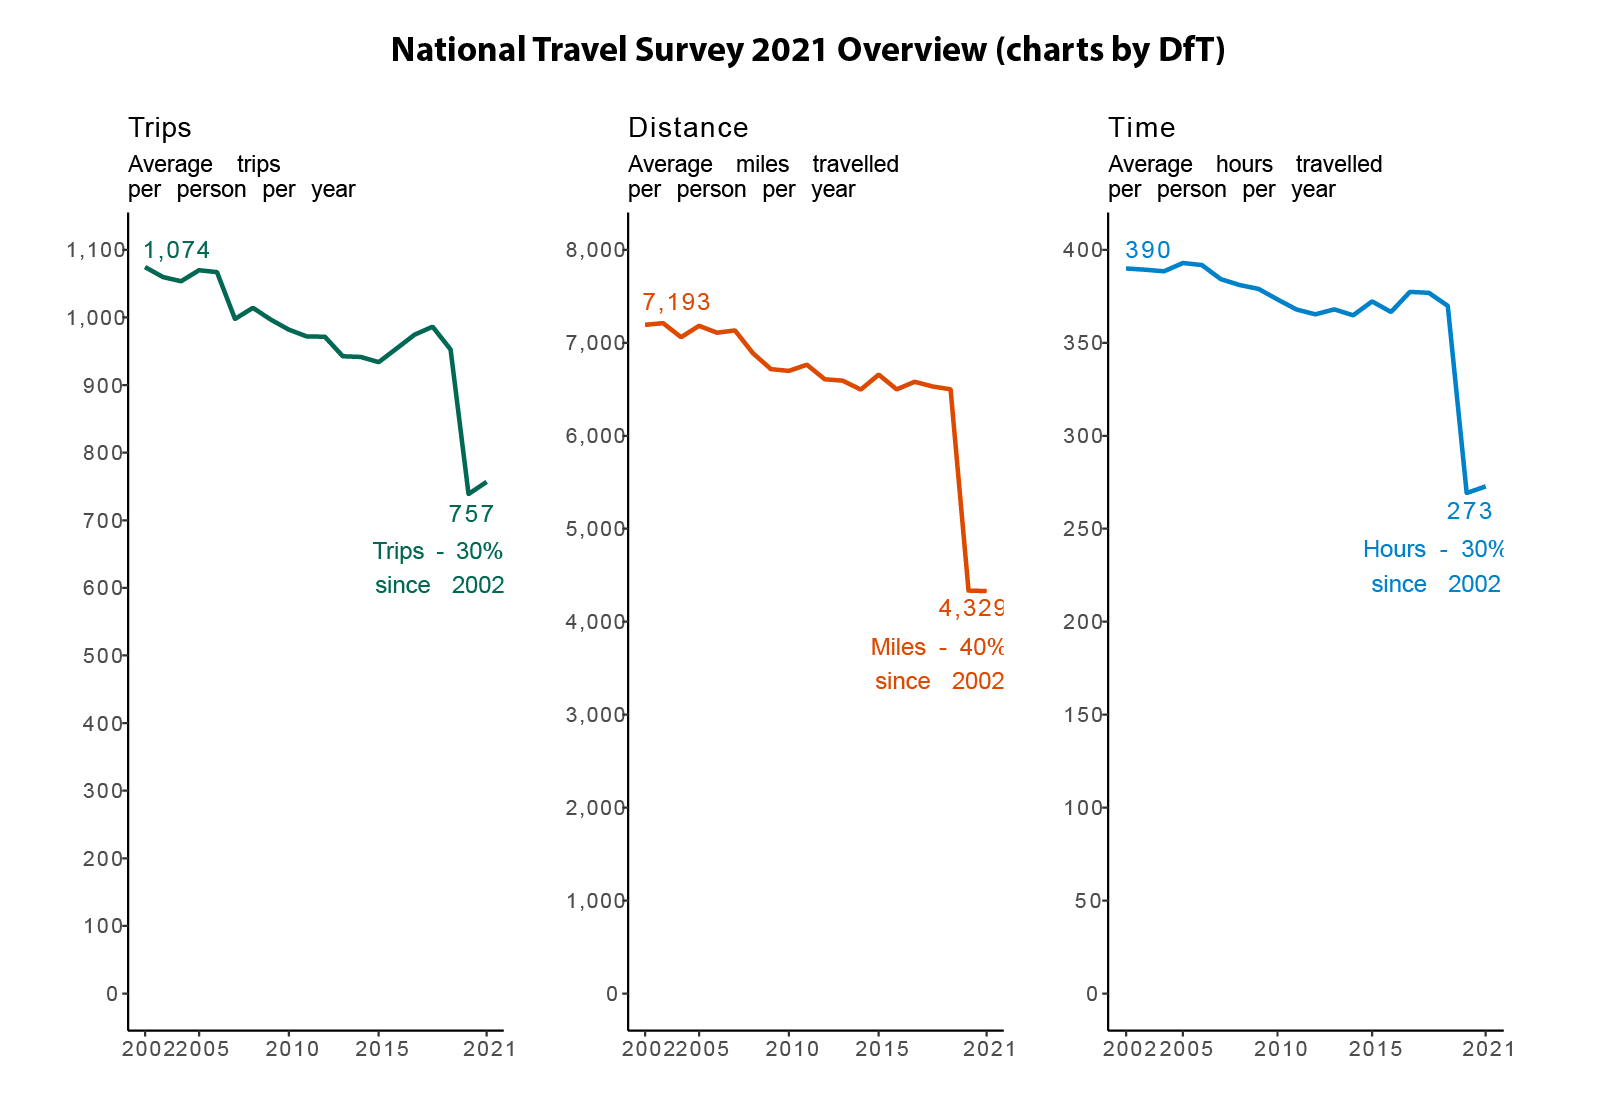
National Travel Survey Data 2021
The results for the National Travel Survey 2021 data were released at the end of August 2022. This long running survey records full travel diaries of thousands of residents in England, allowing analysis of topics such as trip purposes, walking trips and demographic analysis. There have been some data gathering challenges during the pandemic (see data quality report). The overall picture from the DfT chart below is that the 2021 NTS data is very similar to the 2020 data in terms of per person trips and annual distance recorded. This suggests that the NTS 2021 is not picking up much of the 2021 travel recovery that is shown in the DfT timeseries data we discussed above.
We can break down the annual trip distance per person by transport mode. The chart below compares the years 2019, 2020 and 2021. The results backs up the conclusion that, at the national level, the 2021 data is very similar to 2020. There is big reduction in car miles of 30%, while public transport levels are at around half the levels of 2019. There is a small increase in walking and cycling distances, though this falls back to 2019 levels in 2021.

Interestingly, the equivalent chart for London shows a very different picture in terms of travel behaviour responses. Car use increased marginally in 2020 (probably substituting for public transport trips) then falls in 2021, though this reduction is lower than the national picture. Bear in mind London mileages are around a third of the national average, so there may be fewer optional trips to cut. Meanwhile, public transport records a significant recovery in 2021 for rail and underground, much closer to the DfT time series analysis shown above (note the bus recovery is lower than expected). Walking and cycling follows the national picture by increasing in 2020 and then falling in 2021, though note that the 2021 cycling level is substantially up on the 2019 figure.

Overall the broad 2021 National Travel Survey results are fairly close to the 2020 results at the national level. In comparison to the DfT Transport use timeseries, it appears to be closer to the 2020 picture rather than the 2022 trend of a substantial recovery in transportation use. So we may have to wait for the National Travel Survey 2022 to confirm which changes are really sticking in terms of longer term behaviour. The London data is interesting, as it much more clearly shows a recovery in public transport travel in 2021, and a different picture for changes in car mileage, as well as a substantial increase in cycling.
Trip Purpose Analysis
An important question is the type of trips most affected by the pandemic, and whether these changes are becoming longer term trends. The charts below show the trips per person per year and total distance per year between 2019 and 2021. As expected commuting is taking the biggest hit in terms of trips and distance, falling by 36% in distance terms and with only small signs of recovery in the 2021 NTS data. Drops in business travel are even larger, more than halving. Interestingly shopping trips have taken nearly as big a hit as commuting, with distances falling 26%. There has been a widespread trend towards online supermarket deliveries and online shopping more generally post-pandemic and it looks like this behaviour has continued into 2021. The 2021 NTS even shows shopping trips and distances falling again in 2021 from the 2020 level. Alongside commuting changes, shopping travel behaviour looks to be the major trip type that has been cut, possibly for the longer term.


Outside of commuting and shopping, other trip types with big reductions include holidays, business, and entertainment. In contrast day trips increased and walking trips nearly doubled (though both fell back marginally in 2021 from the 2020 peak). Visiting friends at their home also continued during the pandemic, with a more minor reduction in trips and distances.
Finally we repeat the distance trip purpose chart for London. Commuting takes an even bigger hit in London, falling by 48% in 2020, then moderately picking up in 2021. Business trips fell by a huge 67% and there is little sign of recovery. In contrast some trip types that declined in 2020 are nearly back at 2019 levels, such as education and education/other escort trips. The trips with the biggest increases in 2020, visiting friends at private homes and day trips, have also returned to their 2019 levels in the 2021 data. Walking trips have however remained considerably above their 2019 level, indicating that the active travel increase is looking more stable for London.

Summary
The DfT timeseries data shows travel patterns settling into a ‘new normal’ after more than two years of disruption. Car travel is only marginally down on pre-pandemic levels, while public transport is around 70-85% of the passenger numbers from 2019. There are some encouraging signs for active travel after increases in leisure walking and cycling trips, though the situation is dynamic.
The National Travel Survey 2021 data records a similar picture overall to 2020 in terms of major disruption- distances and trips down substantially. Car miles are down 30%, though the DfT timeseries data suggests this will not be the case in the 2022 data. Public transport remains around half of 2019 levels.
The trip types with the biggest reductions are commuting and business as expected, but also shopping (and the related travel type of personal business). Shopping trips fell again in 2021, and this looks, like commuting, to be a case of significant online substitution, possibly long term.
The London NTS data is very interesting, with some significant differences. Car use appears to have marginally increased in London in 2020, before falling in 2021 below 2019 levels. Public transport has staged a major comeback in London in the 2021 data, and there is also a sustained increase in cycling. The NTS data is also disaggregated into urban/rural categories and it would be interesting to test whether these trends are London specific or shared with other major English cities.
