This workshop is an introduction to accessibility analysis of public transport (transit) and walking trips using the R5 (Rapid Realistic Routing on Real-world and Reimagined networks) engine by Conveyal, which is able to model multi-modal trips, interchanges and handle travel time variation across time. To access the R5 software we will be using the r5r library by IPEA Brazil. This workshop is a general introduction – comprehensive references are the Manual and online docs.
Accessibility analysis can answer questions such as how easy is it to reach local services in different city neighbourhoods using public transport and walking. Or how large is the labour market in different urban centres by rail/metro/tram/bus. These kind of questions can be addressed through mapping and through statistical analysis.
Transit Schedule Data- GTFS
To be able to model public transport accessibility for a city accurately we need transit service and timetable information, so that walk times, wait times, in-vehicle times and interchange times can be realistically captured. The common international format for schedule data is GTFS (General Transit Feed Specification). GTFS data is available for lots of cities around the world (though is biased towards Europe, North America and Australia/NZ). You can explore GTFS availability on popular websites such as Transit Feeds and Transit Land. Street network data is also needed for walking trips, and this is available globally through OpenStreetMap.
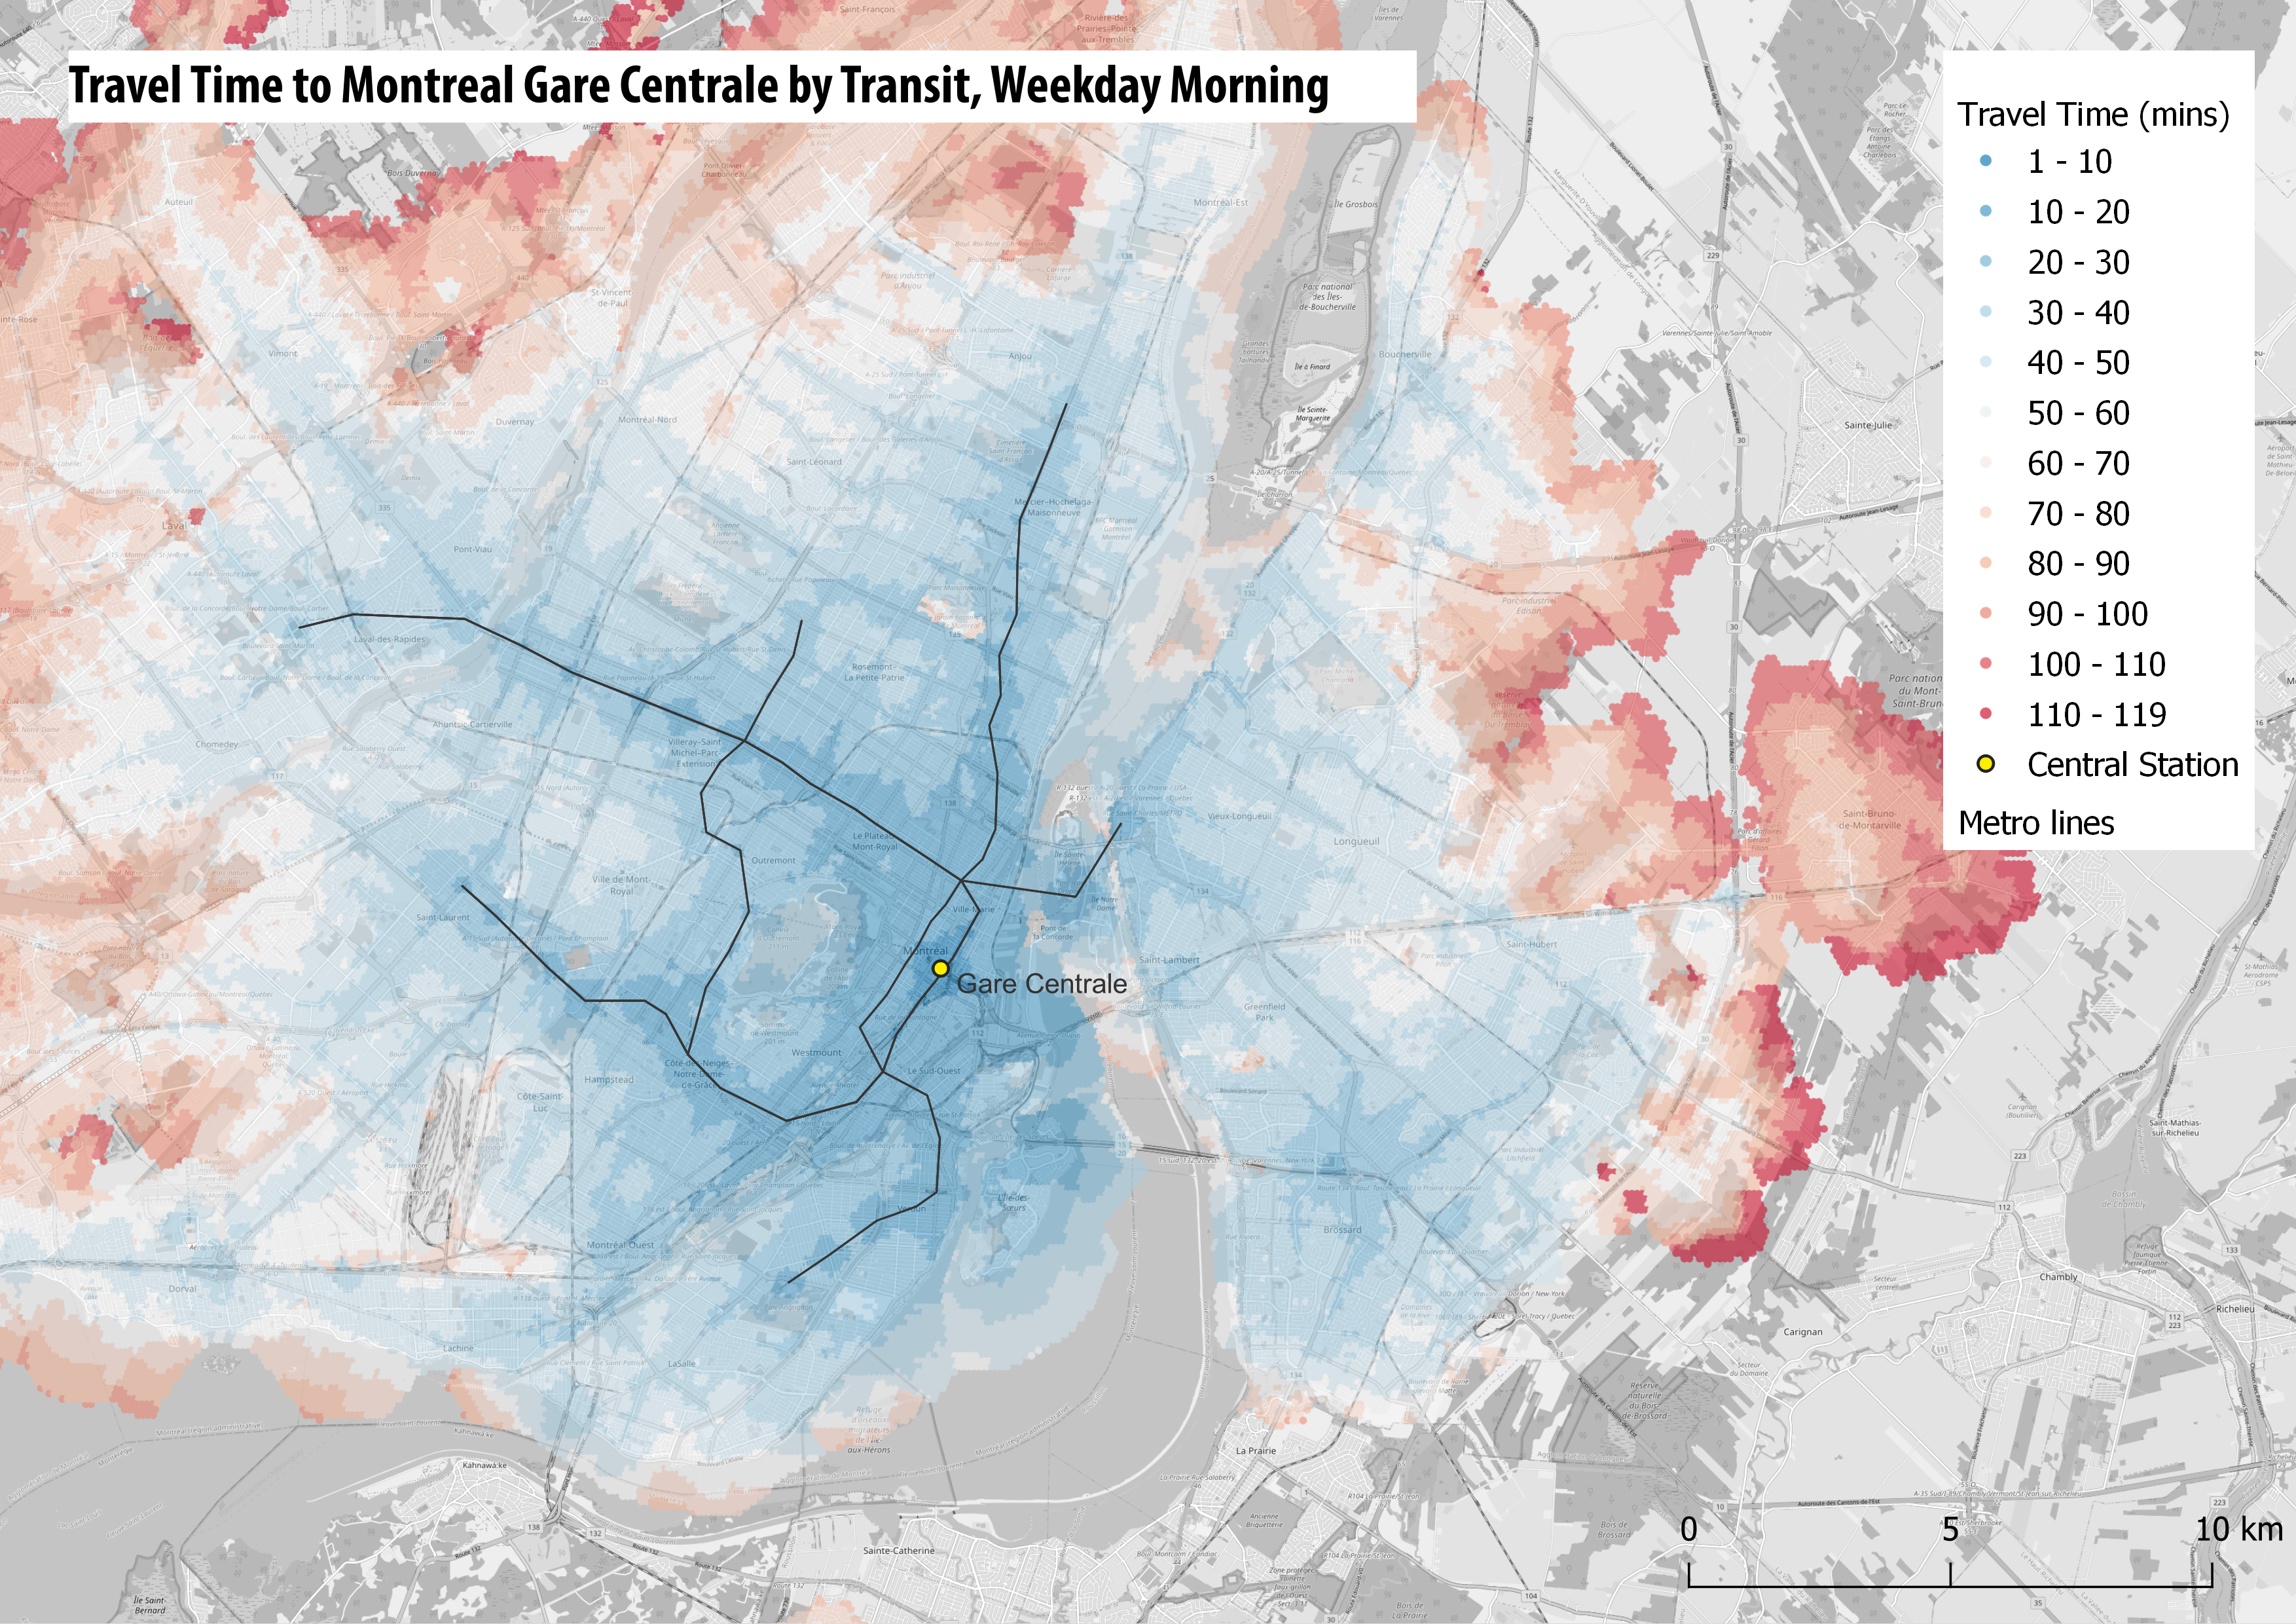
Workshop Example Cities- Montreal Canada, and London UK
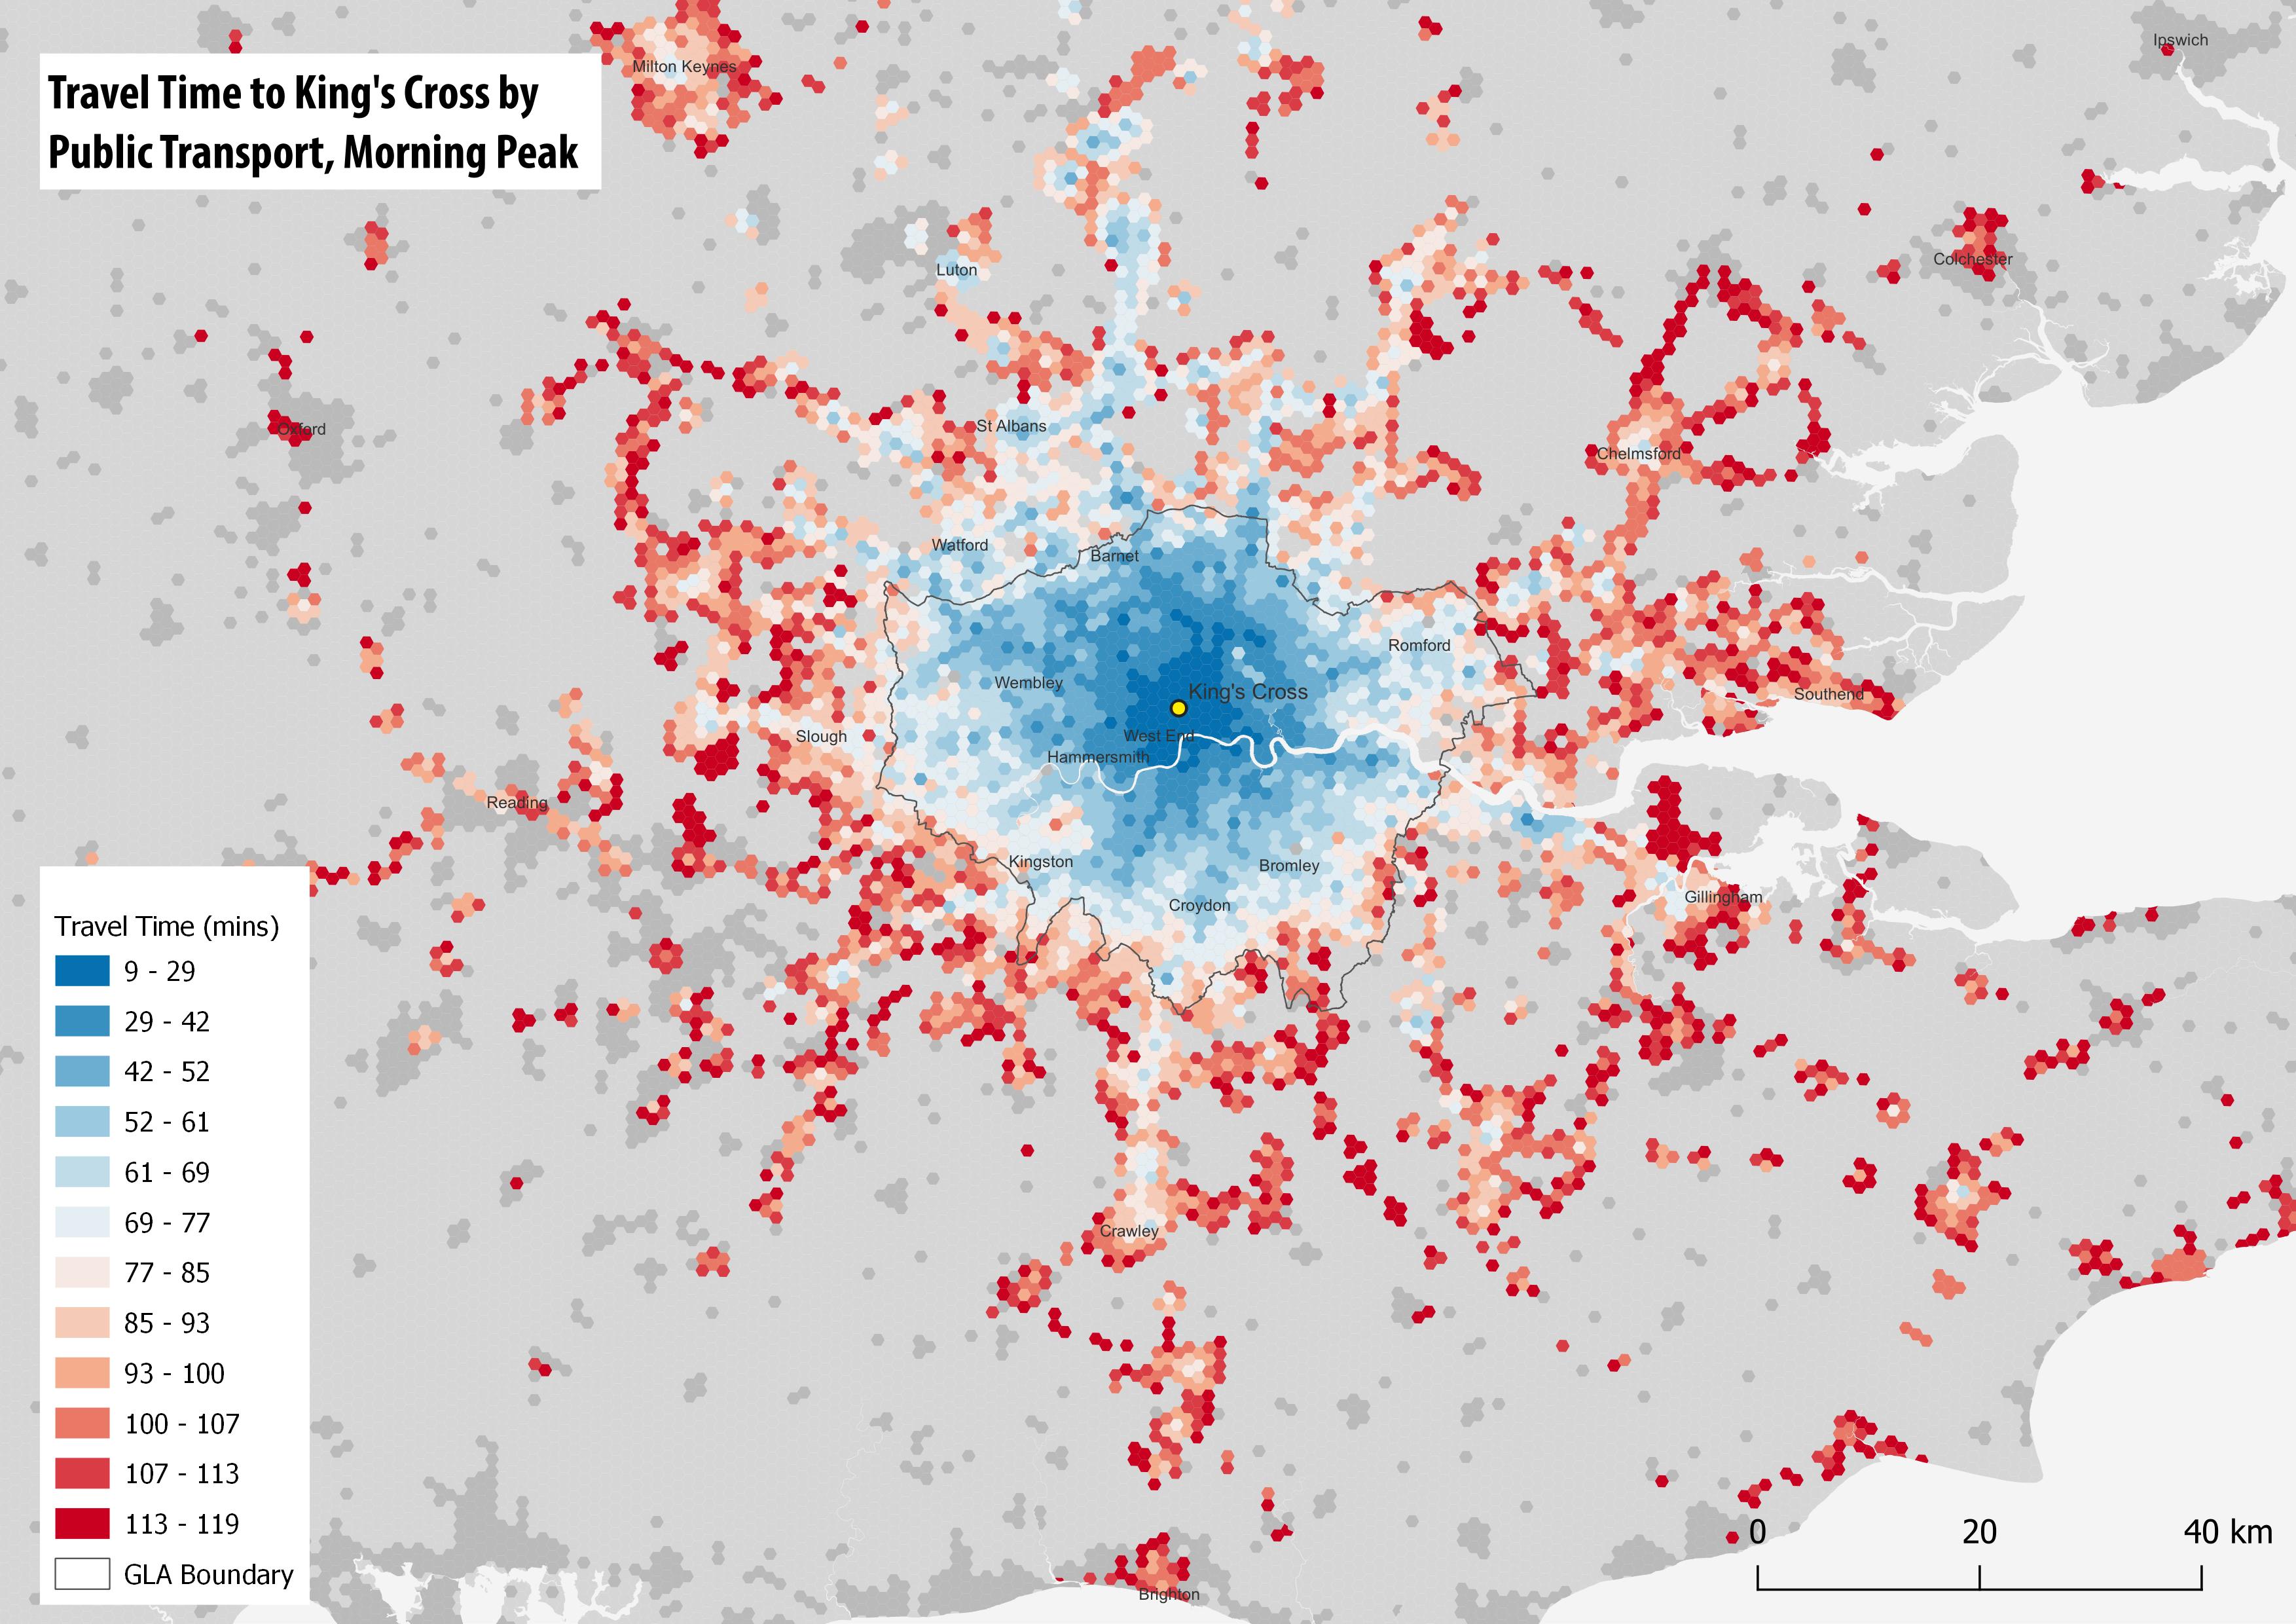
The example cities used in this workshop are Montreal and London. Montreal is a medium sized city with a metro and bus network, and is a good example to get started with. London is a large city with a very extensive underground, bus and rail network, and is used as an example of modelling a large city.
Workshop Pages–
- R5R Accessibility Workshop Intro
- Getting Started & Installation
- Transit Schedule & Street Network Data
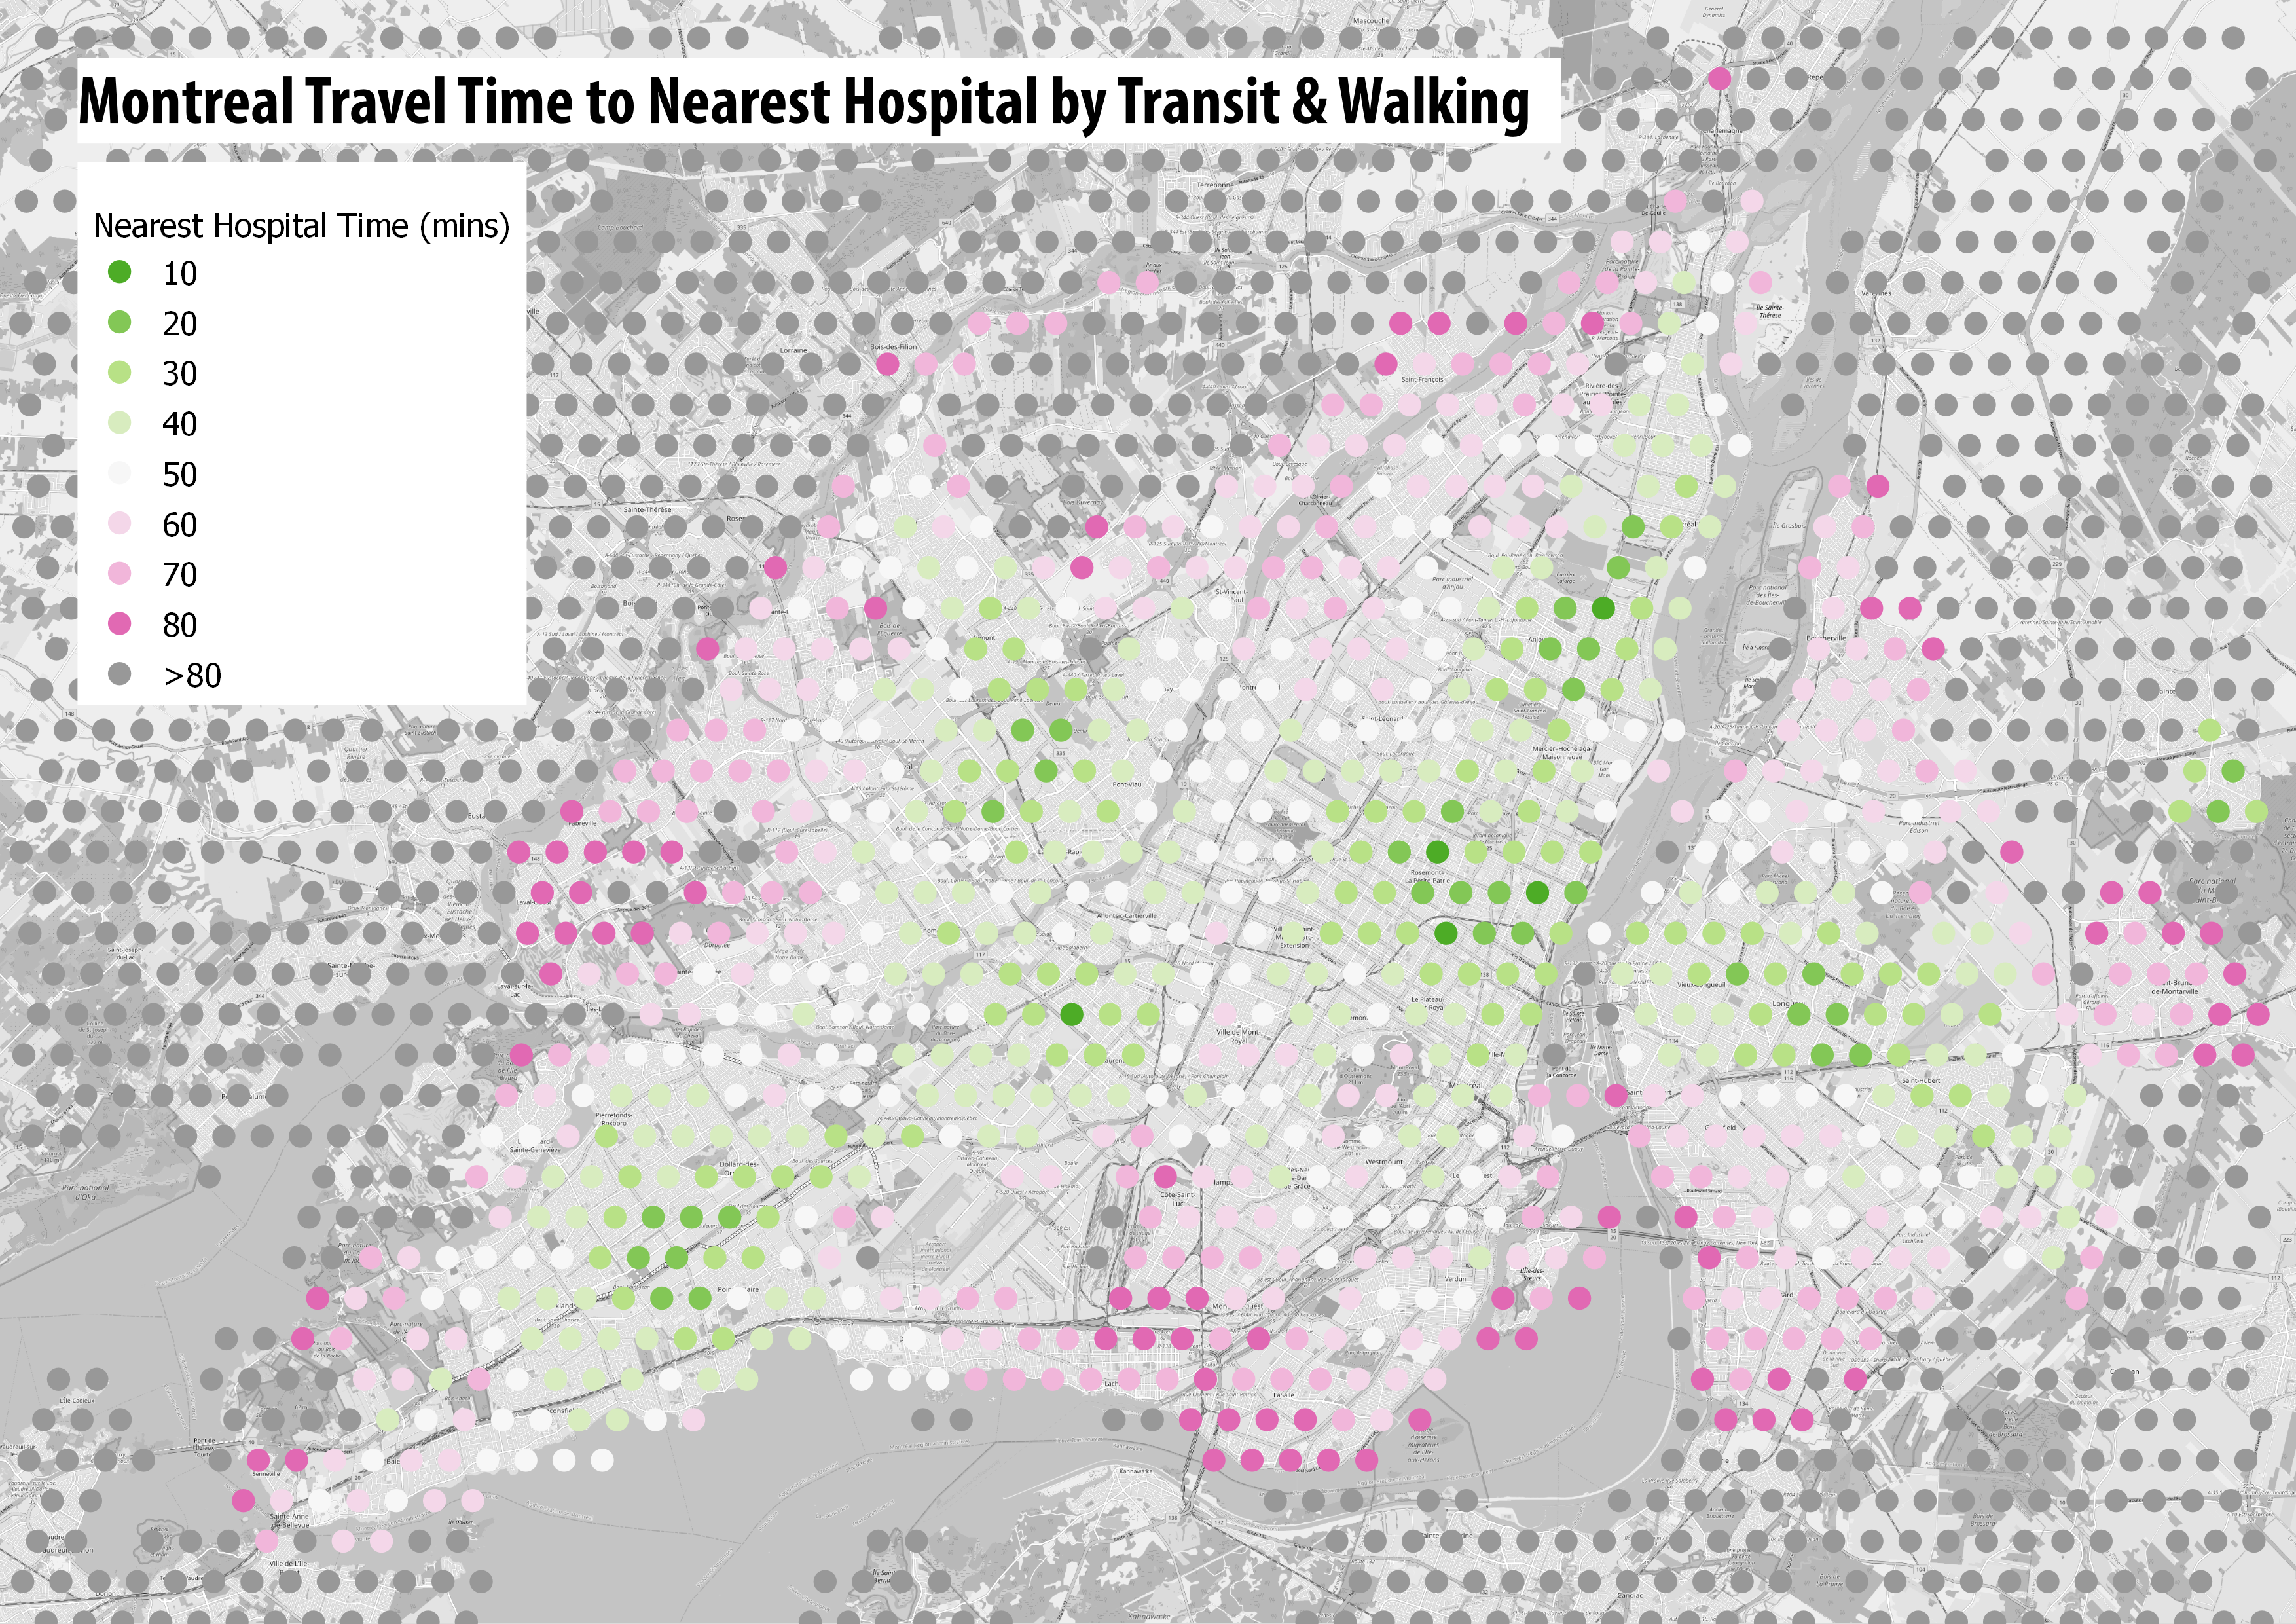
- Accessibility Example 1 – Access to Facilities: Retail & Hospitals
- Accessibility Example 2 – Travel Time Matrix and Isochrones
- UK Transit Data – TransXchange & ATOC
- London in R5 and Modelling Large Cities
- Accessibility Analysis Further Resources
Workshop presentation slides-
